|

NZD/USD Price Analysis: Holds near 0.5725 with short-term moving averages supporting bullish tilt

  • NZD/USD was seen hovering around the 0.5725 area on Wednesday, showing mild losses within a narrow intraday range.
  • While oscillators show mixed signals, shorter-term moving averages lean bullish, keeping the upside potential intact.
  • Support aligns at 0.5722–0.5725 zone, while resistance caps upside around 0.5732–0.5740 levels.

The NZD/USD pair traded with limited traction during Wednesday’s session ahead of the Asian open, seen around the 0.5725 zone. Despite a mild decline on the day, the pair continues to hold in a tight range, consolidating recent gains while staying above key short-term support levels. Momentum remains mixed, yet the bullish structure still holds, supported by shorter-term trend indicators.

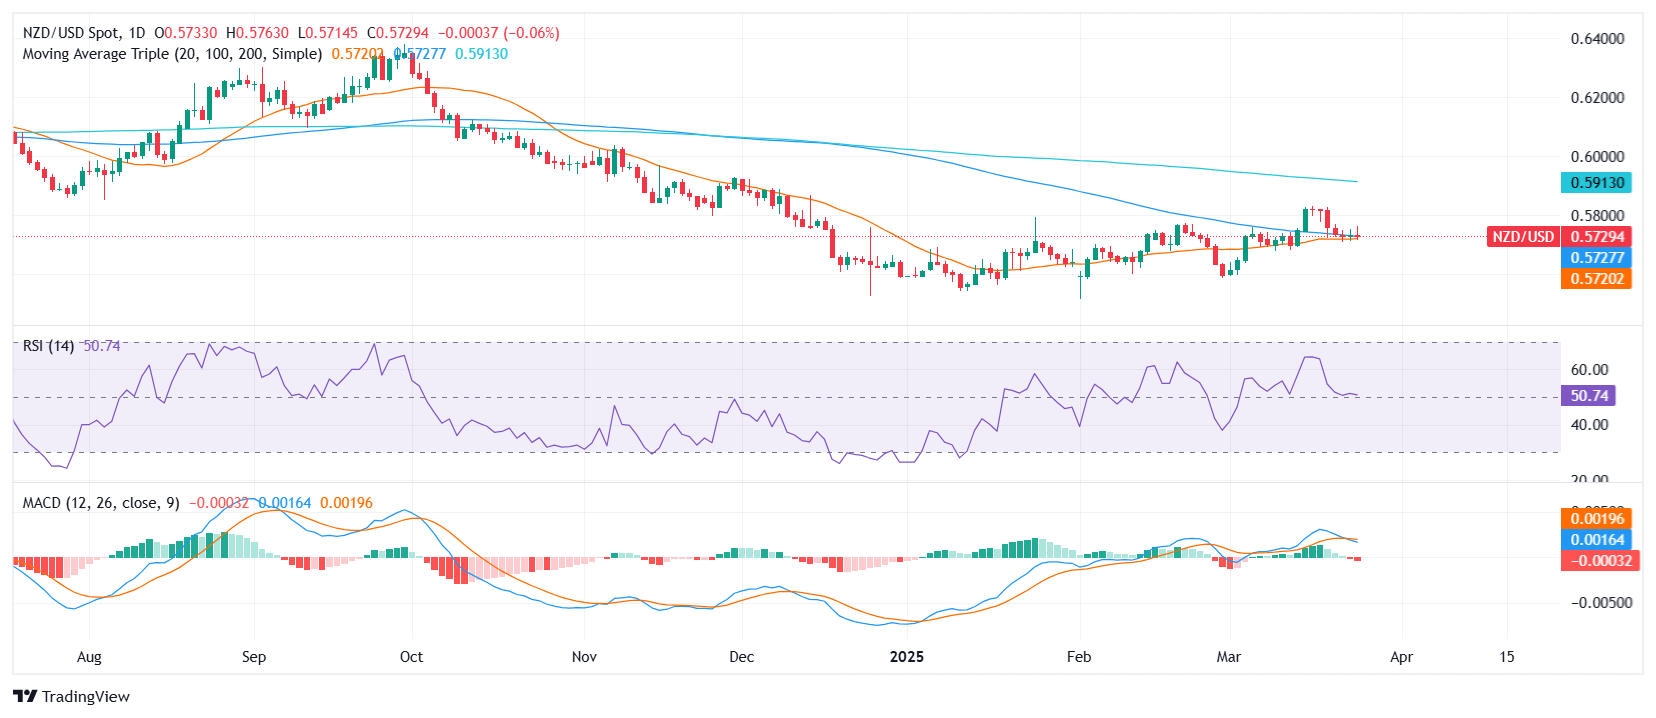
Technically, the Moving Average Convergence Divergence (MACD) signlas a mild bearish bias, while the Relative Strength Index (RSI) sits near 51, offering a neutral stance. The Bull Bear Power indicator, however, suggests latent buying interest. Meanwhile, the combined RSI/Stochastic oscillator also reads neutral, highlighting indecision in the momentum picture.

From a trend perspective, the 20-day Simple Moving Average at 0.5725 and both the 30-day EMA and SMA near 0.5723 continue to support short-term upside bias. However, traders should take note of the congestion between the 100-day and 20-day SMAs, currently at 0.5733 and 0.5720, respectively.

Support is stacked closely at 0.5725, 0.5723, and 0.5722, while resistance lies ahead at 0.5732, followed by 0.5740. A clean break above the latter may spark renewed interest toward higher levels, while failure to hold the support cluster could lead to short-term weakness.

NZD/USD daily chart

Author

Patricio Martín

Patricio is an economist from Argentina passionate about global finance and understanding the daily movements of the markets.

More from Patricio Martín
Share:

Editor's Picks

EUR/USD falls to near 1.1600 due to persistent bearish bias

EUR/USD depreciates after registering modest gains in the previous session, trading around 1.1610 during the Asian hours on Thursday. The technical analysis of the daily chart suggests a persistent bearish bias as the EUR/USD pair remains within the descending channel pattern.

GBP/USD underperforms as UK faces stagflation risks amid Middle East war

The Pound Sterling trades lower against its major currency peers, is down 0.22% around 1.3340 against the US Dollar, during the Asian trade on Thursday. The British currency faces selling pressures amid fears that the United Kingdom economy could face stagflation risks due to higher energy prices, a situation in which inflation accelerates with economic growth and employment conditions remaining stagnant.

Gold climbs near $5,200 as Iran war fuels safe-haven demand

Gold price extends its gains for the second successive session on Thursday as traders seek safety amid the ongoing war in the Middle East. US and Israeli strikes across Iranian territory and widespread Iranian missile and drone retaliation across the Middle East, including attacks on regional targets and military sites, prolong the crisis and its impact.

Top Crypto Gainers: Decred, Zcash, and Dogecoin lead recovery as Bitcoin crosses $72,000

Bitcoin trades above $72,500 at press time on Thursday, holding its 6% gain from the previous day, contributing to a broader market recovery. The total cryptocurrency market capitalization stands at over $2.43 trillion as the broader market sentiment improves significantly.

First Venezuela, now Iran: The US-China energy war escalates

At first glance, the latest escalation involving the United States with both Iran and Venezuela looks like another chapter in a long-running geopolitical story. But viewed through a broader strategic lens, something else may be unfolding: Energy.

Cardano Price Analysis: Approaches key trendline amid bearish sentiment

Cardano (ADA) price is approaching its descending trendline around $0.28 at the time of writing, set to shape the next directional move. The derivatives metrics paint a bearish picture, with ADA’s Open Interest continuing to fall and short bets rising among traders.