|

NZD/USD Price Analysis: Further upside hinges on 0.6415 breakout

  • NZD/USD grinds near intraday high as key resistance confluence challenges buyers.
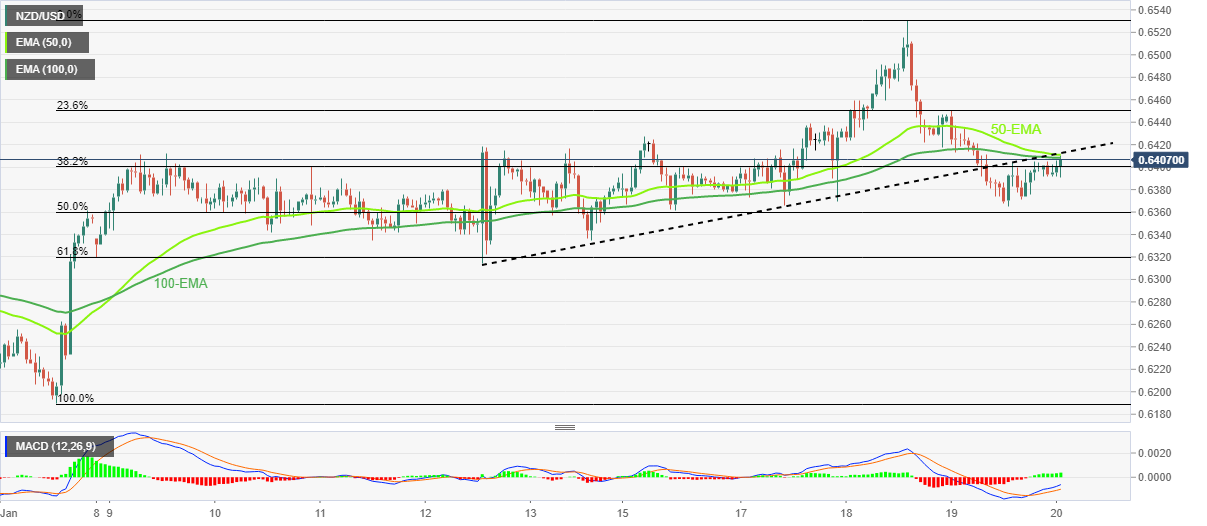
  • Convergence of 50-EMA, 100-EMA and one-week-old previous support line probe Kiwi bulls.
  • Sellers need validation from 0.6315 to retake control.

NZD/USD buyers attack the short-term key hurdle above 0.6400 while bracing for the second weekly gain on early Friday. In doing so, the Kiwi pair also consolidates the previous day’s losses, the biggest on daily play in two weeks, as the People’s Bank of China (PBOC) defends its easy-money policy with the latest status quo.

PBOC kept the one-year and five-year LPRs unchanged at 3.65% and 4.30%, as expected, during its latest monetary policy meeting. With this, the Chinese central bank keeps the rates unchanged for the fifth consecutive month and defends its easy-money policy.

Even if the PBOC-led risk-on mood joins the softer US Dollar to propel the NZD/USD price, the 100-bar Exponential Moving Average (EMA) joins the 50-EMA and the weekly support-turned-resistance to challenge the bulls around 0.6415.

It should be noted that the bullish MACD signals keep buyers hopeful of crossing the stated hurdle.

Following that, the 0.6460 and the 0.6500 round figure may please the Kiwi bulls before directing them to the monthly peak of 0.6531.

Alternatively, the previous day’s low of 0.6365 restricts the immediate downside of the quote, a break of which will highlight the 61.8% Fibonacci retracement level of the NZD/USD pair’s January 06-18 upside, near 0.6315.

In a case where NZD/USD remains weaker past 0.6315, the odds of witnessing a slump toward the monthly low of 0.6190 can’t be ruled out.

NZD/USD: Hourly chart

Trend: Pullback expected

Additional important levels

Overview
Today last price0.6407
Today Daily Change0.0009
Today Daily Change %0.14%
Today daily open0.6398
 
Trends
Daily SMA200.6342
Daily SMA500.6304
Daily SMA1000.6061
Daily SMA2000.6202
 
Levels
Previous Daily High0.645
Previous Daily Low0.6365
Previous Weekly High0.6418
Previous Weekly Low0.6314
Previous Monthly High0.6514
Previous Monthly Low0.623
Daily Fibonacci 38.2%0.6397
Daily Fibonacci 61.8%0.6418
Daily Pivot Point S10.6359
Daily Pivot Point S20.6319
Daily Pivot Point S30.6274
Daily Pivot Point R10.6444
Daily Pivot Point R20.6489
Daily Pivot Point R30.6529

Author

Anil Panchal

Anil Panchal

FXStreet

Anil Panchal has nearly 15 years of experience in tracking financial markets. With a keen interest in macroeconomics, Anil aptly tracks global news/updates and stays well-informed about the global financial moves and their implications.

More from Anil Panchal
Share:

Markets move fast. We move first.

Orange Juice Newsletter brings you expert driven insights - not headlines. Every day on your inbox.

By subscribing you agree to our Terms and conditions.

Editor's Picks

EUR/USD moves sideways below 1.1800 on Christmas Eve

EUR/USD struggles to find direction and trades in a narrow channel below 1.1800 after posting gains for two consecutive days. Bond and stock markets in the US will open at the usual time and close early on Christmas Eve, allowing the trading action to remain subdued. 

GBP/USD keeps range around 1.3500 amid quiet markets

GBP/USD keeps its range trade intact at around 1.3500 on Wednesday. The Pound Sterling holds the upper hand over the US Dollar amid pre-Christmas light trading as traders move to the sidelines heading into the holiday season. 

Gold retreats from record highs, trades below $4,500

Gold retreats after setting a new record-high above $4,520 earlier in the day and trades in a tight range below $4,500 as trading volumes thin out ahead of the Christmas break. The US Dollar selling bias remains unabated on the back of dovish Fed expectations, which continues to act as a tailwind for the bullion amid persistent geopolitical risks.

Shiba Inu's bears tighten grip, aiming for yearly lows

Shiba Inu price remains under pressure, trading below $0.000070 on Wednesday as bearish momentum continues to dominate the broader crypto market. On-chain and derivatives data further support the bearish sentiment, while technical analysis suggests a deeper correction targeting the yearly lows.

Economic outlook 2026-2027 in advanced countries: Solidity test

After a year marked by global economic resilience and ending on a note of optimism, 2026 looks promising and could be a year of solid economic performance. In our baseline scenario, we expect most of the supportive factors at work in 2025 to continue to play a role in 2026.

Stellar Price Forecast: XLM slips below $0.22 as bearish momentum builds

Stellar (XLM) price is trading below $0.22 at the time of writing on Wednesday after failing to close above the key resistance earlier this week. Bearish momentum continues to strengthen, with open interest falling and short bets rising.