|

NZD/USD Price Analysis: Further upside hinges on 0.6270 breakout

  • NZD/USD seesaws in a choppy range after confirming a bullish chart formation and refreshing two-week high.
  • Convergence of 21-day EMA, 200-day EMA challenges Kiwi pair buyers.
  • Looming bull cross on MACD defends upside bias.

NZD/USD bulls struggle to justify the falling wedge breakout as the key moving averages challenge upside near the mid-0.6200s during early Thursday. However, the impending bull cross on the MACD indicator keeps the Kiwi pair buyers hopeful, especially after the confirmation of the bullish chart pattern the previous day.

The upside break of a one-month-old falling wedge bullish formation failed to cross the convergence of the 200-day Exponential Moving Average (EMA) and the 21-day EMA, around 0.6270 by the press time.

Should the quote crosses the immediate hurdle, as expected due to the MACD conditions and falling wedge confirmation, the NZD/USD can quickly poke the mid-February swing high surrounding 0.6390.

In a case where the Kiwi buyers keep the reins past 0.6390, as well as cross the 0.6400 threshold, the highs marked in the last December and the previous month, respectively near 0.6515 and 0.6540, could act as buffers during the theoretical run-up targeting 0.6600.

Meanwhile, pullback moves remain less important until the quote stays beyond the aforementioned wedge’s top line, close to 0.6175 at the latest.

It’s worth noting that January’s low of 0.6190 acts as the immediate support for the NZD/USD bears to watch during the fresh fall.

That said, lows marked during November 14 and 17 around 0.6060 appear the key for the pair sellers to track as a break of which won’t hesitate to challenge the 0.6000 psychological magnet.

NZD/USD: Daily chart

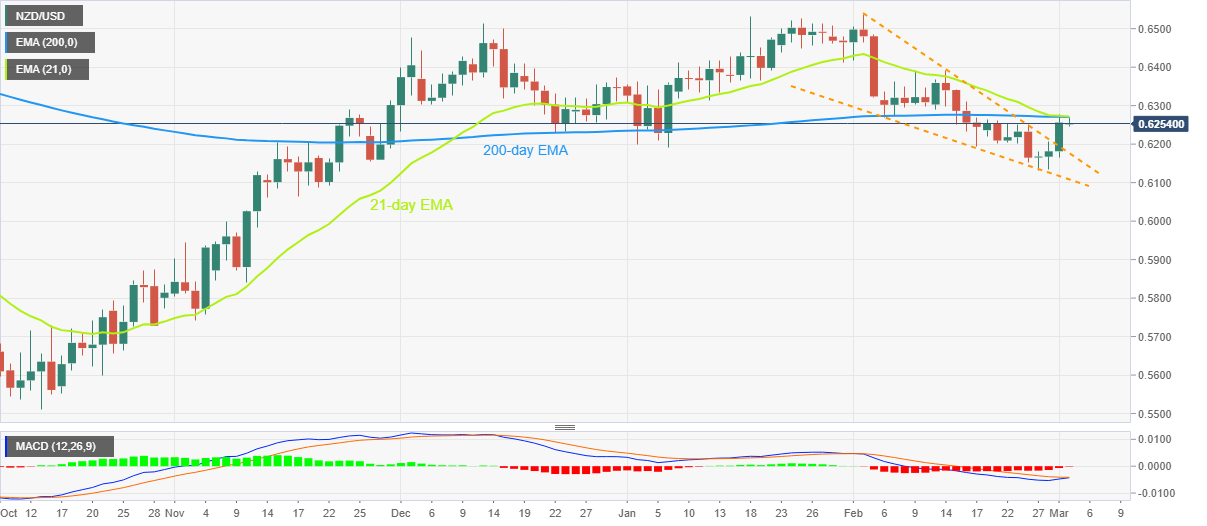
Trend: Further upside expected

Additional important levels

Overview
Today last price0.6254
Today Daily Change0.0073
Today Daily Change %1.18%
Today daily open0.6181
 
Trends
Daily SMA200.6289
Daily SMA500.6341
Daily SMA1000.6198
Daily SMA2000.6182
 
Levels
Previous Daily High0.6208
Previous Daily Low0.6133
Previous Weekly High0.6263
Previous Weekly Low0.6151
Previous Monthly High0.6538
Previous Monthly Low0.6131
Daily Fibonacci 38.2%0.6179
Daily Fibonacci 61.8%0.6162
Daily Pivot Point S10.614
Daily Pivot Point S20.6099
Daily Pivot Point S30.6065
Daily Pivot Point R10.6215
Daily Pivot Point R20.6249
Daily Pivot Point R30.6291

Author

Anil Panchal

Anil Panchal

FXStreet

Anil Panchal has nearly 15 years of experience in tracking financial markets. With a keen interest in macroeconomics, Anil aptly tracks global news/updates and stays well-informed about the global financial moves and their implications.

More from Anil Panchal
Share:

Editor's Picks

EUR/USD rises to 1.1800 neighborhood amid renewed USD selling and trade uncertainties

The EUR/USD pair regains positive traction during the Asian session on Wednesday and jumps to the 1.1800 neighborhood in the last hour, reversing the previous day's modest losses. The intraday move up is sponsored by the emergence of fresh US Dollar, which continues to be weighed down by persistent trade-related uncertainties.

GBP/USD remains stronger above 1.3500 following Trump’s State of the Union

GBP/USD remains in the positive territory for the fourth successive session, trading around 1.3510 during the Asian hours on Wednesday. The pair appreciates as the US Dollar remains subdued following US President Donald Trump’s first State of the Union address of his second administration before a joint session of Congress.

Gold re-attempts $5,200 amid tariffs and geopolitical woes

Gold buyers are back in the game early Wednesday after seeing a correction from monthly highs on Tuesday. The US Dollar slips after Trump’s SOTU fails to impress and as AI-driven worries ease. Dovish Fed bets also weigh.  Gold looks north so long as the key 61.8% Fibo resistance at $5,142 holds on the daily chart.

Bitcoin, Ethereum and Ripple post cautious recovery amid downside risks

Bitcoin, Ethereum, and Ripple are posting a cautious recovery on Wednesday following a market correction earlier this week.  BTC is approaching a key breakdown level, while ETH and XRP are rebounding from crucial support levels.

The Citrini report: How a debatable AI narrative can shake Wall Street

That AI-related headline alone was enough to rattle investors.US stocks slid sharply on Monday after a widely circulated Citrini Research memo outlined a hypothetical “2028 Global Intelligence Crisis”, warning that rapid AI adoption could push US unemployment into double digits as early as by mid-2028.

XRP pressured by weak ETF flows and declining retail interest

Ripple (XRP) is edging lower, trading above its intraday low of $1.32 at the time of writing on Tuesday. The decline from its weekly opening of $1.39 reflects heightened volatility in the broader cryptocurrency market, accentuated by tariff-triggered uncertainty.