|

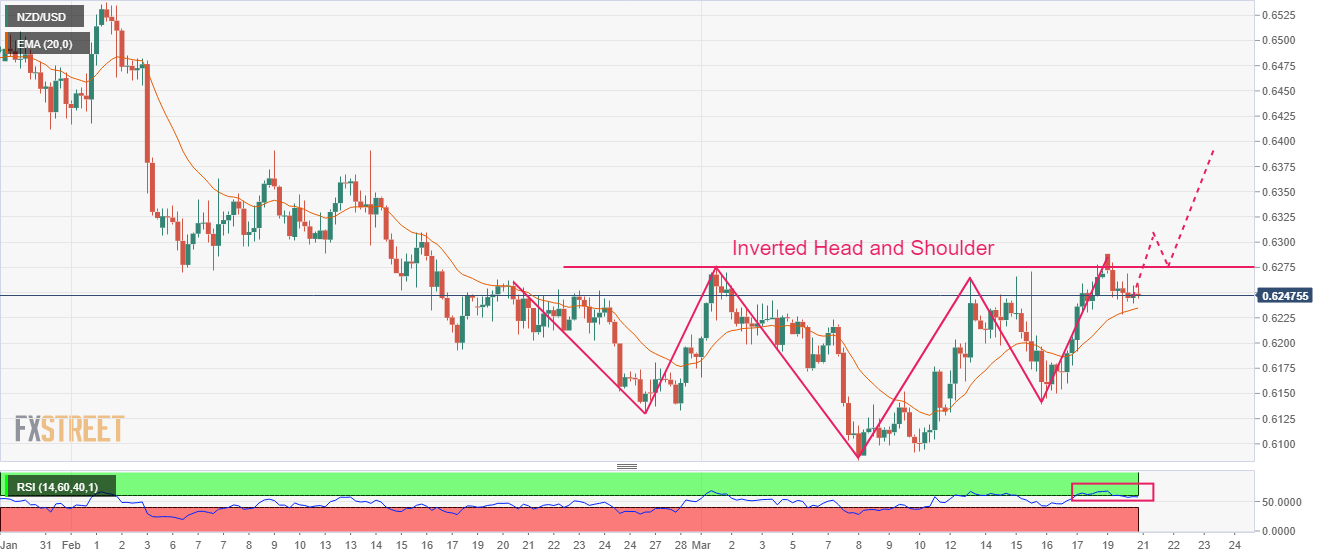
NZD/USD Price Analysis: Formation of an Inverted H&S favors a solid upside

  • NZD/USD has remained sideways after failing to recapture the immediate resistance of 0.6280.
  • The formation of an Inverted H&S formation solidifies a bullish reversal ahead.
  • The 20-period EMA at 0.6234 is providing a cushion to the New Zealand Dollar.

The NZD/USD pair is making efforts in defending the critical support of 0.6240 in the early Asian session. The Kiwi asset has remained sideways from Monday after failing to recapture the immediate resistance of 0.6280. Mixed responses to the interest rate policy of the Federal Reserve (Fed) have shifted the major to the sideline.

S&P500 futures have continued their upside momentum after a decent recovery on Monday, portraying appreciation in the risk-taking ability of the market participants. The US Dollar Index (DXY) continued its losing spell on Monday led by United States banking shakedown.

The New Zealand Dollar didn’t display any significant action on steady monetary policy by the People’s Bank of China (PBoC). The street was anticipating further rate cuts to spurt the overall demand in the Chinese economy. It is worth noting that New Zealand is one of the crucial trading partners of China and further expansion in PBoC’s monetary policy would have supported the New Zealand Dollar.

NZD/USD is forming an Inverted Head and Shoulder chart pattern on a four-hour scale. The chart pattern displays a prolonged consolidation and results in a bullish reversal after a breakout of the neckline, which is plotted from the March 01 high at 0.6276.

The 20-period Exponential Moving Average (EMA) at 0.6234 is providing a cushion to the New Zealand Dollar.

Meanwhile, the Relative Strength Index (RSI) (14) is making efforts in reclaiming the bullish range of 60.00-80.00. An occurrence of the same would solidify the Kiwi asset further.

A buying opportunity in the Kiwi asset will emerge it will surpass March 1 high at 0.6276, which will drive the pair toward the round-level resistance at 0.6300 followed by February 14 high at 0.6389.

In an alternate scenario, a breakdown of the January 6 low at 0.6193 will drag the asset toward November 28 low at 0.6155. A slippage below the latter will expose the asset for more downside toward the round-level support at 0.6100.

NZD/USD four-hour chart

NZD/USD

Overview
Today last price0.6247
Today Daily Change-0.0022
Today Daily Change %-0.35
Today daily open0.6269
 
Trends
Daily SMA200.6194
Daily SMA500.6313
Daily SMA1000.6263
Daily SMA2000.6162
 
Levels
Previous Daily High0.6278
Previous Daily Low0.6178
Previous Weekly High0.6278
Previous Weekly Low0.6131
Previous Monthly High0.6538
Previous Monthly Low0.6131
Daily Fibonacci 38.2%0.624
Daily Fibonacci 61.8%0.6216
Daily Pivot Point S10.6205
Daily Pivot Point S20.6141
Daily Pivot Point S30.6105
Daily Pivot Point R10.6305
Daily Pivot Point R20.6342
Daily Pivot Point R30.6406

Author

Sagar Dua

Sagar Dua

FXStreet

Sagar Dua is associated with the financial markets from his college days. Along with pursuing post-graduation in Commerce in 2014, he started his markets training with chart analysis.

More from Sagar Dua
Share:

Markets move fast. We move first.

Orange Juice Newsletter brings you expert driven insights - not headlines. Every day on your inbox.

By subscribing you agree to our Terms and conditions.

Editor's Picks

EUR/USD recovers to 1.1750 region as 2025 draws to a close

Following the bearish action seen in the European session on Wednesday, EUR/USD regains its traction and recovery to the 1.1750 region. Nevertheless, the pair's volatility remains low as trading conditions thin out on the last day of the year.

GBP/USD stays weak near 1.3450 on modest USD recovery

GBP/USD remains under modest beairsh pressure and fluctuates at around 1.3450 on Wednesday. The US Dollar finds fresh demand due to the end-of-the-year position adjustments, weighing on the pair amid the pre-New Year trading lull. 

Gold retreats to $4,300 area, looks to post monthly gains

Gold stays on the back foot on the last day of 2025 and trades near $4,300, possibly pressured by profit-taking and position adjustments. Nevertheless, XAU/USD remains on track to post gains for December and extend its winning streak into a fifth consecutive month.

Bitcoin, Ethereum and XRP prepare for a potential New Year rebound

Bitcoin, Ethereum, and Ripple are holding steady on Wednesday after recording minor gains on the previous day. Technically, Bitcoin could extend gains within a triangle pattern while Ethereum and Ripple face critical overhead resistance. 

Economic outlook 2026-2027 in advanced countries: Solidity test

After a year marked by global economic resilience and ending on a note of optimism, 2026 looks promising and could be a year of solid economic performance. In our baseline scenario, we expect most of the supportive factors at work in 2025 to continue to play a role in 2026.

Crypto market outlook for 2026

Year 2025 was volatile, as crypto often is.  Among positive catalysts were favourable regulatory changes in the U.S., rise of Digital Asset Treasuries (DAT), adoption of AI and tokenization of Real-World-Assets (RWA).