NZD/USD Price Analysis: Falls sharply to 0.6100 as focus shifts to RBNZ policy decision
- NZD/USD slumps to 0.6100 ahead of RBNZ monetary policy decision.
- The US Dollar steadies as investors shift focus to FOMC minutes.
- US yields rise as Fed maintains a hawkish guidance on the interest rate outlook.

The NZD/USD pair faces selling pressure and drops to the round-level support of 0.6100 in Monday’s New York session. The Kiwi asset drops comes under pressure as the New Zealand Dollar weakens ahead of the Reserve Bank of New Zealand’s (RBNZ) interest rate decision, which will be announced on Wednesday.
Investors expect that the RBNZ will keep its Official Cash Rate (OCR) steady at 5.5%. Therefore, market participants will focus on cues about when the RBNZ will start reducing interest rates. Currently, financial markets see the RBNZ shifting to policy-normalization next year.
Meanwhile, the US Dollar Index (DXY) rises to 104.60 as investors turn slightly cautious ahead of the Federal Open Market Committee (FOMC) minutes for the May meeting, which will be published on Wednesday. The FOMC minutes will indicate policymakers’ view on the interest rate outlook.
10-year US Treasury yields rise to 4.44% as Fed policymakers emphasize keeping interest rates higher for a longer period despite an expected decline in the US Consumer Price Index (CPI) data for April. The annual headline and core CPI declined to 3.4% and 3.6%, respectively.
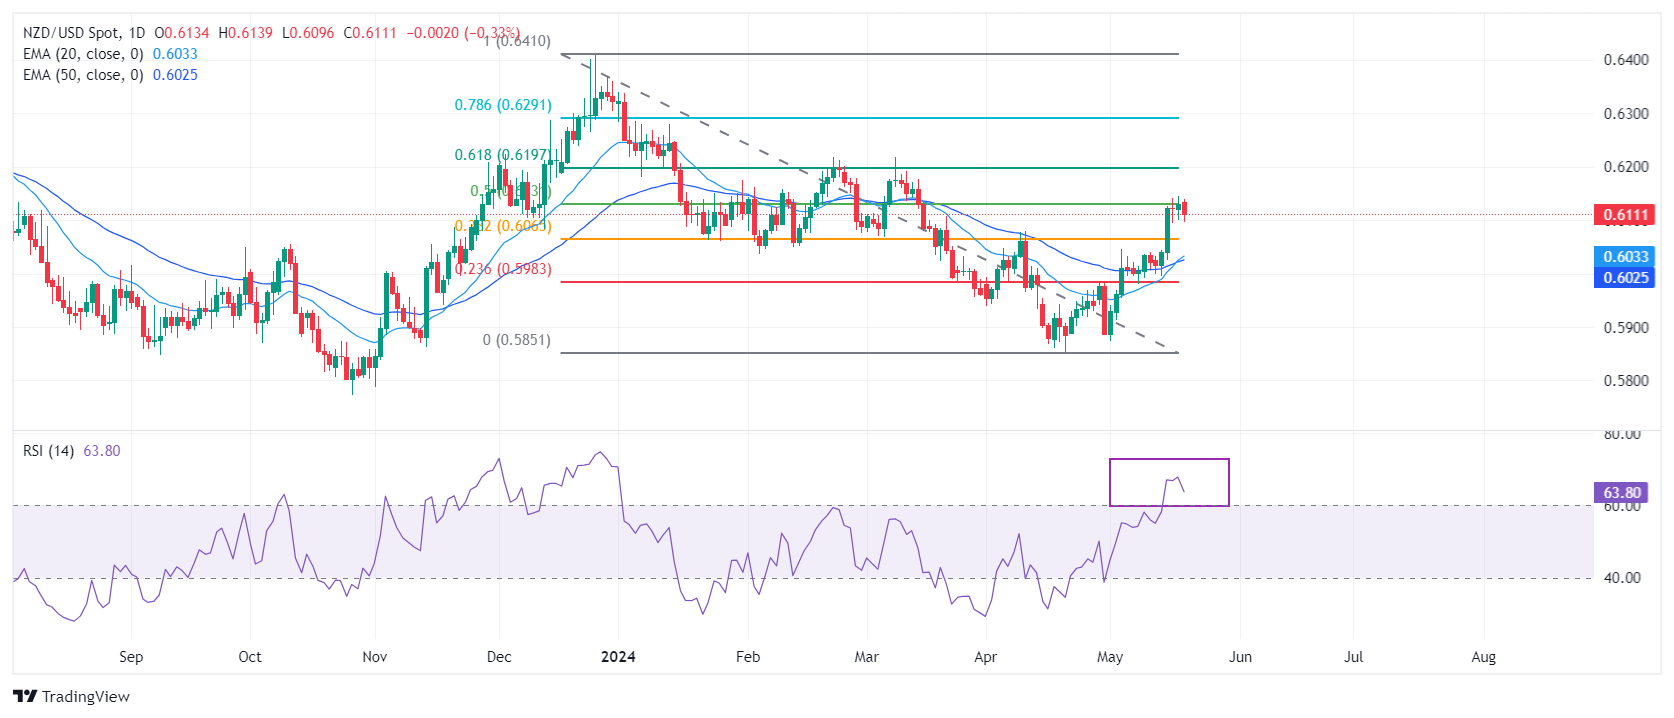
NZD/USD extends recovery to 50% Fibonacci retracement (plotted from December 26 high at 0.6410 to April 19 low around 0.5850) at 0.6130 on a daily timeframe. The near-term outlook of the Kiwi asset has improved as the 20-and 50-day Exponential Moving Averages (EMAs) around 0.6017. The 14-period Relative Strength Index (RSI) has shifted comfortably into the bullish range of 60.00-80.00, suggesting that the momentum has leaned toward the upside.
An upside move above February 9 high of 0.6160 will drive the asset towards 61.8% Fibo retracement at 0.6200, followed by January 15 high near 0.6250
On the contrary, fresh downside would appear if the asset breaks below April 4 high around 0.6050 This would drag the asset towards the psychological support of 0.6000 and April 25 high at 0.5969.
NZD/USD daily chart
New Zealand Dollar PRICE TodaY
The table below shows the percentage change of New Zealand Dollar (NZD) against listed major currencies today. New Zealand Dollar was the strongest against the Australian Dollar.
| USD | EUR | GBP | JPY | CAD | AUD | NZD | CHF | |
|---|---|---|---|---|---|---|---|---|
| USD | 0.03% | -0.02% | 0.28% | -0.03% | 0.24% | 0.33% | -0.06% | |
| EUR | -0.03% | -0.09% | 0.29% | -0.06% | 0.25% | 0.31% | -0.08% | |
| GBP | 0.02% | 0.09% | 0.24% | 0.03% | 0.33% | 0.38% | -0.01% | |
| JPY | -0.28% | -0.29% | -0.24% | -0.34% | -0.03% | 0.06% | -0.33% | |
| CAD | 0.03% | 0.06% | -0.03% | 0.34% | 0.23% | 0.36% | -0.02% | |
| AUD | -0.24% | -0.25% | -0.33% | 0.03% | -0.23% | 0.04% | -0.33% | |
| NZD | -0.33% | -0.31% | -0.38% | -0.06% | -0.36% | -0.04% | -0.39% | |
| CHF | 0.06% | 0.08% | 0.00% | 0.33% | 0.02% | 0.33% | 0.39% |
The heat map shows percentage changes of major currencies against each other. The base currency is picked from the left column, while the quote currency is picked from the top row. For example, if you pick the New Zealand Dollar from the left column and move along the horizontal line to the US Dollar, the percentage change displayed in the box will represent NZD (base)/USD (quote).
Author

Sagar Dua
FXStreet
Sagar Dua is associated with the financial markets from his college days. Along with pursuing post-graduation in Commerce in 2014, he started his markets training with chart analysis.


