|

NZD/USD Price Analysis: Drops back to 0.6100 within monthly bearish channel

  • NZD/USD fades bounce off the lowest levels since late November 2022 inside one-month-old descending trend channel.
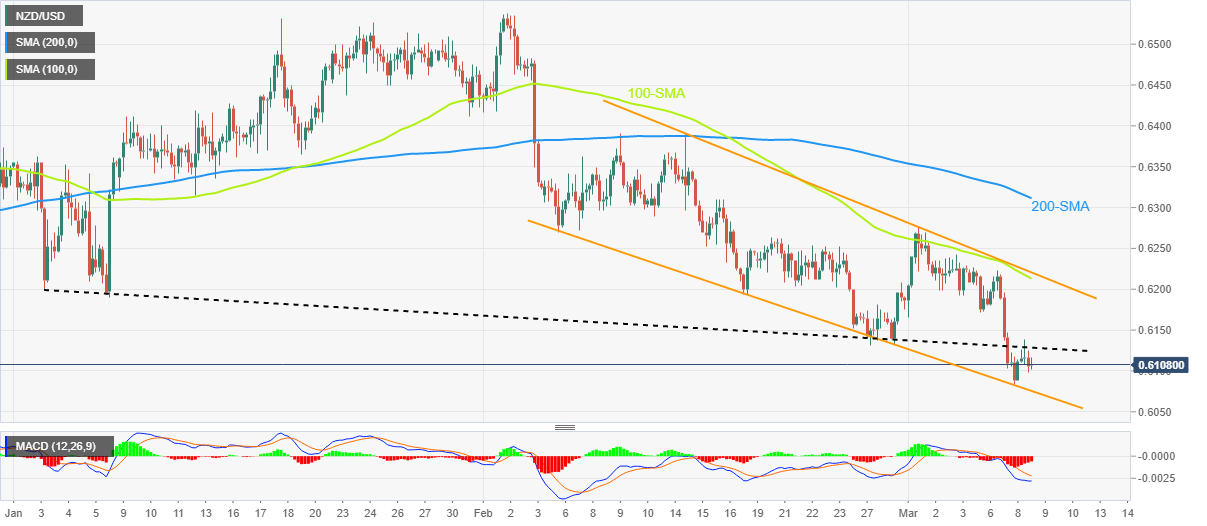
  • Failure to cross previous support line from early January, bearish MACD signals keep sellers hopeful.
  • Recovery remains elusive below 200-SMA, 0.6215-20 acts as an additional upside filter.

NZD/USD retreat towards the multi-day low marked the previous day while staying with a one-month-old descending trend channel, pressured around 0.6105 during the early Thursday morning in the Asia-Pacific zone.

In doing so, the Kiwi pair portrays the inability to cross the two-month-long previous support line, now immediate resistance near 0.6130. Adding strength to the downside bias are the bearish MACD signals.

It’s worth noting, however, that the lower line of the aforementioned bearish channel, around 0.6070 by the press time, as well as the lows marked during mid-November 2022 near 0.6060, can act as crucial supports to watch during the NZD/USD pair’s further downside.

Should the Kiwi pair remains bearish past 0.6060, the odds of witnessing a slump toward the 0.6000 psychological magnet can’t be ruled out.

Alternatively, recovery moves remain elusive unless the quote stays below the support-turned-resistance line near 0.6130.

Even so, a convergence of the 100-SMA and the stated channel’s top line, close to 0.6215-20 at the latest, will be important for the NZD/USD buyers to break before retaking control.

Above all, the Kiwi pair remains on the bear’s radar unless it successfully trades above the 200-SMA hurdle surrounding 0.6315.

NZD/USD: Four-hour chart

Trend: Further downside expected

Additional important levels

Overview
Today last price0.6107
Today Daily Change-0.0007
Today Daily Change %-0.11%
Today daily open0.6114
 
Trends
Daily SMA200.6243
Daily SMA500.6332
Daily SMA1000.6227
Daily SMA2000.6174
 
Levels
Previous Daily High0.6223
Previous Daily Low0.6103
Previous Weekly High0.6277
Previous Weekly Low0.6131
Previous Monthly High0.6538
Previous Monthly Low0.6131
Daily Fibonacci 38.2%0.6149
Daily Fibonacci 61.8%0.6177
Daily Pivot Point S10.607
Daily Pivot Point S20.6027
Daily Pivot Point S30.595
Daily Pivot Point R10.619
Daily Pivot Point R20.6267
Daily Pivot Point R30.631

Author

Anil Panchal

Anil Panchal

FXStreet

Anil Panchal has nearly 15 years of experience in tracking financial markets. With a keen interest in macroeconomics, Anil aptly tracks global news/updates and stays well-informed about the global financial moves and their implications.

More from Anil Panchal
Share:

Editor's Picks

AUD/USD falls to near 0.7100 after slipping below 50-day EMA

AUD/USD depreciates after registering minor gains in the previous day, trading around 0.7120 during the Asian hours. The technical analysis of the daily chart shows the pair consolidating sideways within a rectangle pattern, as neither bulls nor bears gain control. The AUD/USD pair is holding a slight bearish tone however as it sits beneath both the nine-day and 50-day EMAs.

160.00: USD/JPY back near intervention territory after upbeat US jobs report

US Nonfarm Payrolls beat expectations by a wide margin in May, with 172K jobs added. The US Dollar rebounds after the release, helping USD/JPY recover from its intraday lows. Warnings from Japanese authorities continue to limit upside potential near the 160.00 threshold.

Gold targets $4,300 amid stronger Dollar

Gold faces increasing selling interest and navigates the area of three-month lows near the $4,300 mark per troy ounce on Friday. The precious metal’s decline comes as traders assess the stronger-than-expected NFP, while the bid bias in the Greenback and higher US Treasury yields also collaborate with the retracement.

Cardano hits five-year low even as Hoskinson clarifies "break" isn't an exit

Cardano (ADA) price is down 10% at press time on Friday, extending losses over 30% so far this week amid Charles Hoskinson's clarification that "break" isn't an exit.

Week ahead – Fed countdown begins amid US inflation data and geopolitical risks

Fed Chair Warsh’s first meeting approaches as key US inflation data could reshape expectations. Oil prices remain elevated as US-Iran talks continue; tariffs also return to the spotlight. ECB is expected to hike; will it be a one-off move or is July live?

The US economy defies the rules: 100 days into the Oil shock and the recession signal is still missing

More than three months after the start of the Iran war and the resulting disruption to global energy markets, the US economy continues to display remarkable resilience. The conflict has triggered a sharp rise in Oil prices, reignited inflationary pressures and fueled widespread concerns about a potential economic slowdown.