|

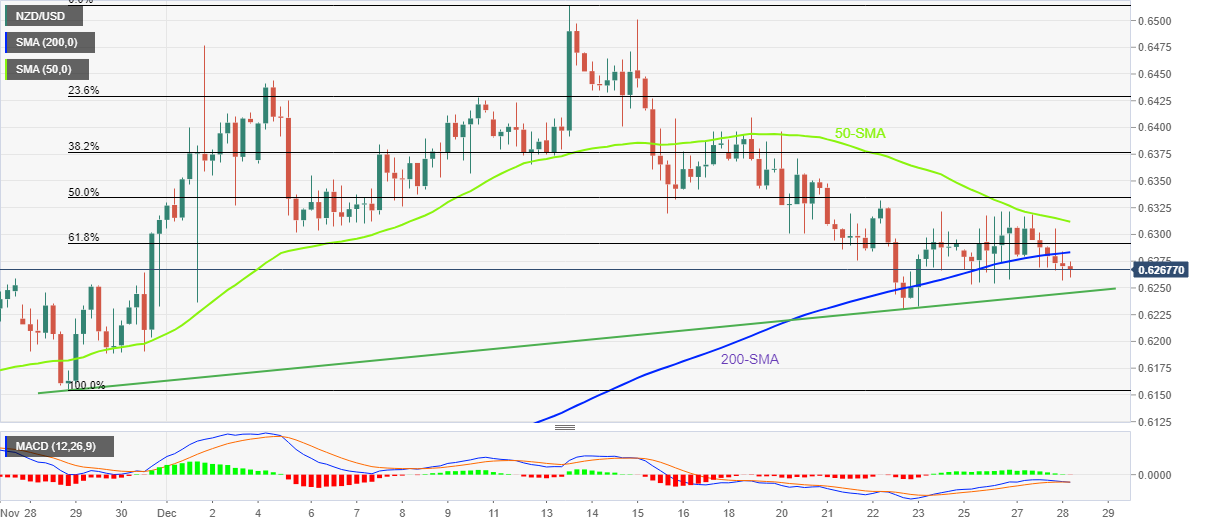
NZD/USD Price Analysis: Drops back below 200-SMA, monthly support line in focus

  • NZD/USD holds lower ground near intraday bottom, extends pullback from 50-SMA.
  • Failure to stay beyond 200-SMA, looming bear cross on MACD favor sellers.
  • One-month-old ascending trend line restricts immediate downside.
  • 61.8% Fibonacci retracement adds to the upside filters.

NZD/USD prints mild losses around 0.6260 as it drops for the second consecutive day heading into Wednesday’s European session.

In doing so, the Kiwi pair not only extends pullback from the 50-SMA but also marks one more downside move below the 200-SMA.

The downside moves also take clues from the impending bear cross on the MACD indicator, as well as the lower high formation marked since December 13.

That said, an upward-sloping support line from November 28, close to 0.6245, holds the key for the NZD/USD pair’s further downside.

Also acting as the short-term key support is the monthly low near 0.6230, quickly followed by late November’s swing low surrounding 0.6290.

Meanwhile, the 61.8% Fibonacci retracement level of the NZD/USD pair’s November 28 to December 13 upside, also known as the “Golden Ratio”, guards immediate recovery moves of the pair around 0.6290, in addition to the 200-SMA hurdle of 0.6283.

During the quote’s run-up beyond 0.6290, the 0.6300 round figure and the 50-SMA resistance of 0.6311 could probe the NZD/USD bulls before giving them control.

Even so, successful trading beyond the 50% Fibonacci retracement level surrounding 0.6335 appears necessary for the Kiwi pair buyers to keep the reins.

NZD/USD: Four-hour chart

Trend: Further downside expected

Additional important levels

Overview
Today last price0.6262
Today Daily Change-0.0013
Today Daily Change %-0.21%
Today daily open0.6275
 
Trends
Daily SMA200.635
Daily SMA500.6122
Daily SMA1000.6043
Daily SMA2000.625
 
Levels
Previous Daily High0.6319
Previous Daily Low0.6258
Previous Weekly High0.641
Previous Weekly Low0.623
Previous Monthly High0.6314
Previous Monthly Low0.5741
Daily Fibonacci 38.2%0.6281
Daily Fibonacci 61.8%0.6296
Daily Pivot Point S10.6249
Daily Pivot Point S20.6224
Daily Pivot Point S30.6189
Daily Pivot Point R10.631
Daily Pivot Point R20.6345
Daily Pivot Point R30.6371

Author

Anil Panchal

Anil Panchal

FXStreet

Anil Panchal has nearly 15 years of experience in tracking financial markets. With a keen interest in macroeconomics, Anil aptly tracks global news/updates and stays well-informed about the global financial moves and their implications.

More from Anil Panchal
Share:

Markets move fast. We move first.

Orange Juice Newsletter brings you expert driven insights - not headlines. Every day on your inbox.

By subscribing you agree to our Terms and conditions.

Editor's Picks

EUR/USD recovers to 1.1750 region as 2025 draws to a close

Following the bearish action seen in the European session on Wednesday, EUR/USD regains its traction and recovery to the 1.1750 region. Nevertheless, the pair's volatility remains low as trading conditions thin out on the last day of the year.

GBP/USD stays weak near 1.3450 on modest USD recovery

GBP/USD remains under modest beairsh pressure and fluctuates at around 1.3450 on Wednesday. The US Dollar finds fresh demand due to the end-of-the-year position adjustments, weighing on the pair amid the pre-New Year trading lull. 

Gold retreats to $4,300 area, looks to post monthly gains

Gold stays on the back foot on the last day of 2025 and trades near $4,300, possibly pressured by profit-taking and position adjustments. Nevertheless, XAU/USD remains on track to post gains for December and extend its winning streak into a fifth consecutive month.

Bitcoin, Ethereum and XRP prepare for a potential New Year rebound

Bitcoin, Ethereum, and Ripple are holding steady on Wednesday after recording minor gains on the previous day. Technically, Bitcoin could extend gains within a triangle pattern while Ethereum and Ripple face critical overhead resistance. 

Economic outlook 2026-2027 in advanced countries: Solidity test

After a year marked by global economic resilience and ending on a note of optimism, 2026 looks promising and could be a year of solid economic performance. In our baseline scenario, we expect most of the supportive factors at work in 2025 to continue to play a role in 2026.

Crypto market outlook for 2026

Year 2025 was volatile, as crypto often is.  Among positive catalysts were favourable regulatory changes in the U.S., rise of Digital Asset Treasuries (DAT), adoption of AI and tokenization of Real-World-Assets (RWA).