|

NZD/USD Price Analysis: Buyers recover, oversold RSI signals potential upturn

  • NZD/USD recovers and seems some gains after Monday’s losses.
  • Oversold RSI hints at potential corrective upswing.
  • The potential correction might take the pair to revisit the 100-day SMA.

Tuesday's session brought a reprieve from the NZD/USD's recent bearish streak, as the pair managed to recoup some of its losses, rising by 0.15% to settle at 0.6045. While the technical outlook remains mixed, the latest price action and indicator readings suggest a potential shift in market sentiment.

The Relative Strength Index (RSI) has rebounded sharply from the negative area, signaling a decline in selling pressure. The indicator's current reading of 37, combined with its upward trajectory, indicates that favorable buying conditions have emerged. The Moving Average Convergence Divergence (MACD) histogram, however, remains flat and red, suggesting that selling forces have not yet relinquished control.

NZD/USD daily chart
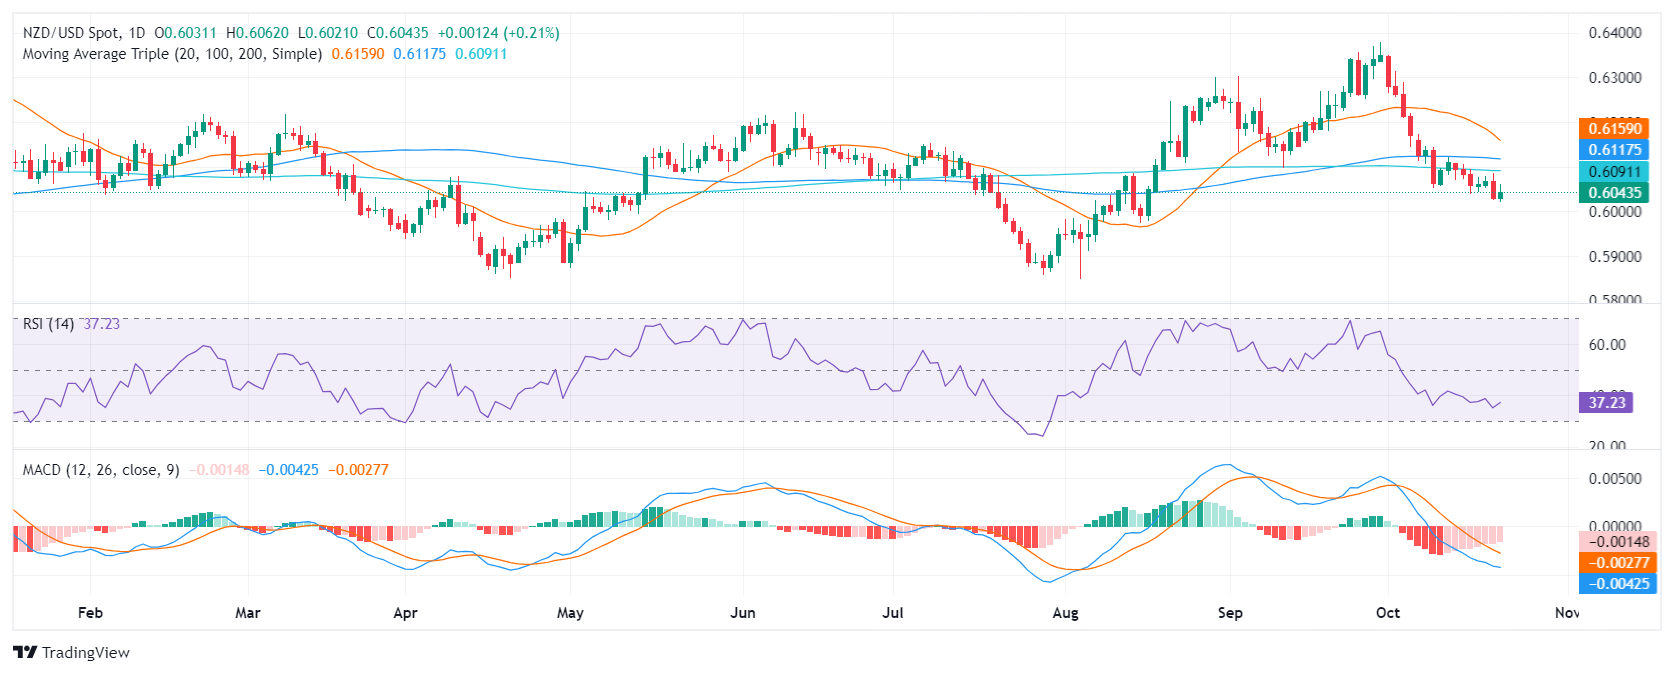
Technically, the NZD/USD pair remains constrained within a range bounded by key support and resistance levels. The critical 100 and 200-day Simple Moving Averages (SMAs) continue to act as formidable barriers at 0.6100 and are likely to impede any significant upward momentum. Despite these obstacles, the pair's recent recovery from lows since mid-August indicates that buyers may be regaining their footing.

Author

Patricio Martín

Patricio is an economist from Argentina passionate about global finance and understanding the daily movements of the markets.


More from Patricio Martín
Share:

Editor's Picks

GBP/USD hits multi-week tops around 1.3560

GBP/USD gathers fresh steam and advances to new three-month peaks near the 1.3560 zone on Friday. Cable’s sharp move higher comes after three daily drops in a row and follows the increasing selling pressure hurting the Greenback.

EUR/USD pops to fresh two-month highs, targets 1.1600

EUR/USD advances markedly, revisiting the upper 1.1500s for the first time since mid-June. The pair’s sharp uptick comes on the back of a strong retracement in the US Dollar amid BoJ intervention chatter and despite steady uncertainty in the Middle East.

Gold picks up pace, approaches $4,400

Gold rebounds toward the $4,400 mark per troy ounce on Friday, reversing the previous day’s pullback. The precious metal’s recovery comes as fresh and intense weakness keep weighing on the US Dollar, while traders keep assessing easing expectations of an imminent Fed interest rate hike and the situation from the Middle East.

Pi Network Price Forecast: PI extends consolidation as bulls eye $0.10
Pi Network (PI) price holds steady on Friday, maintaining a consolidating tone for three consecutive days. Mild retail strength in the PI token remains stable, with Open Interest above $9 million, while social buzz eases. PI token’s technical outlook is mixed, as bearish momentum wanes to neutral, with bulls eyeing the $0.1000 psychological level.
 Weekly focus: Some relief in US inflation concerns

Actual inflation data for July came out as expected with a 0.1% m/m increase in headline CPI and 0.2% excluding food and energy. Annual headline inflation remains too high at 3.4% and means that wage earners are experiencing stagnating spending power at best, and core inflation is a bit higher than the inflation target of two percent would suggest.

Why is Crude Oil priced for a reopening the ships haven't made?
Fourteen vessels crossed the Strait of Hormuz on Tuesday. Before the war, the count ran near 120 a day. In the sessions since the waterway was publicly declared open, Brent has drifted back to $87 and West Texas Intermediate (WTI) to $81, both a little lower again on Wednesday, with daily momentum on each unwound from the top of its range in late July to the low twenties now.














