NZD/USD Price Analysis: Bulls take on 0.62s and eye 50% mean reversion
- NZD/USD bulls in the market and eye a break of trendline resistance.
- 0.6200 is key in this regard as a critical support area.

After the New Zealand Dollar dropped on Monday, moving away from a near two-week high in the previous session, the currency is back in charge vs. the US Dollar and the following illustrates the market structure.
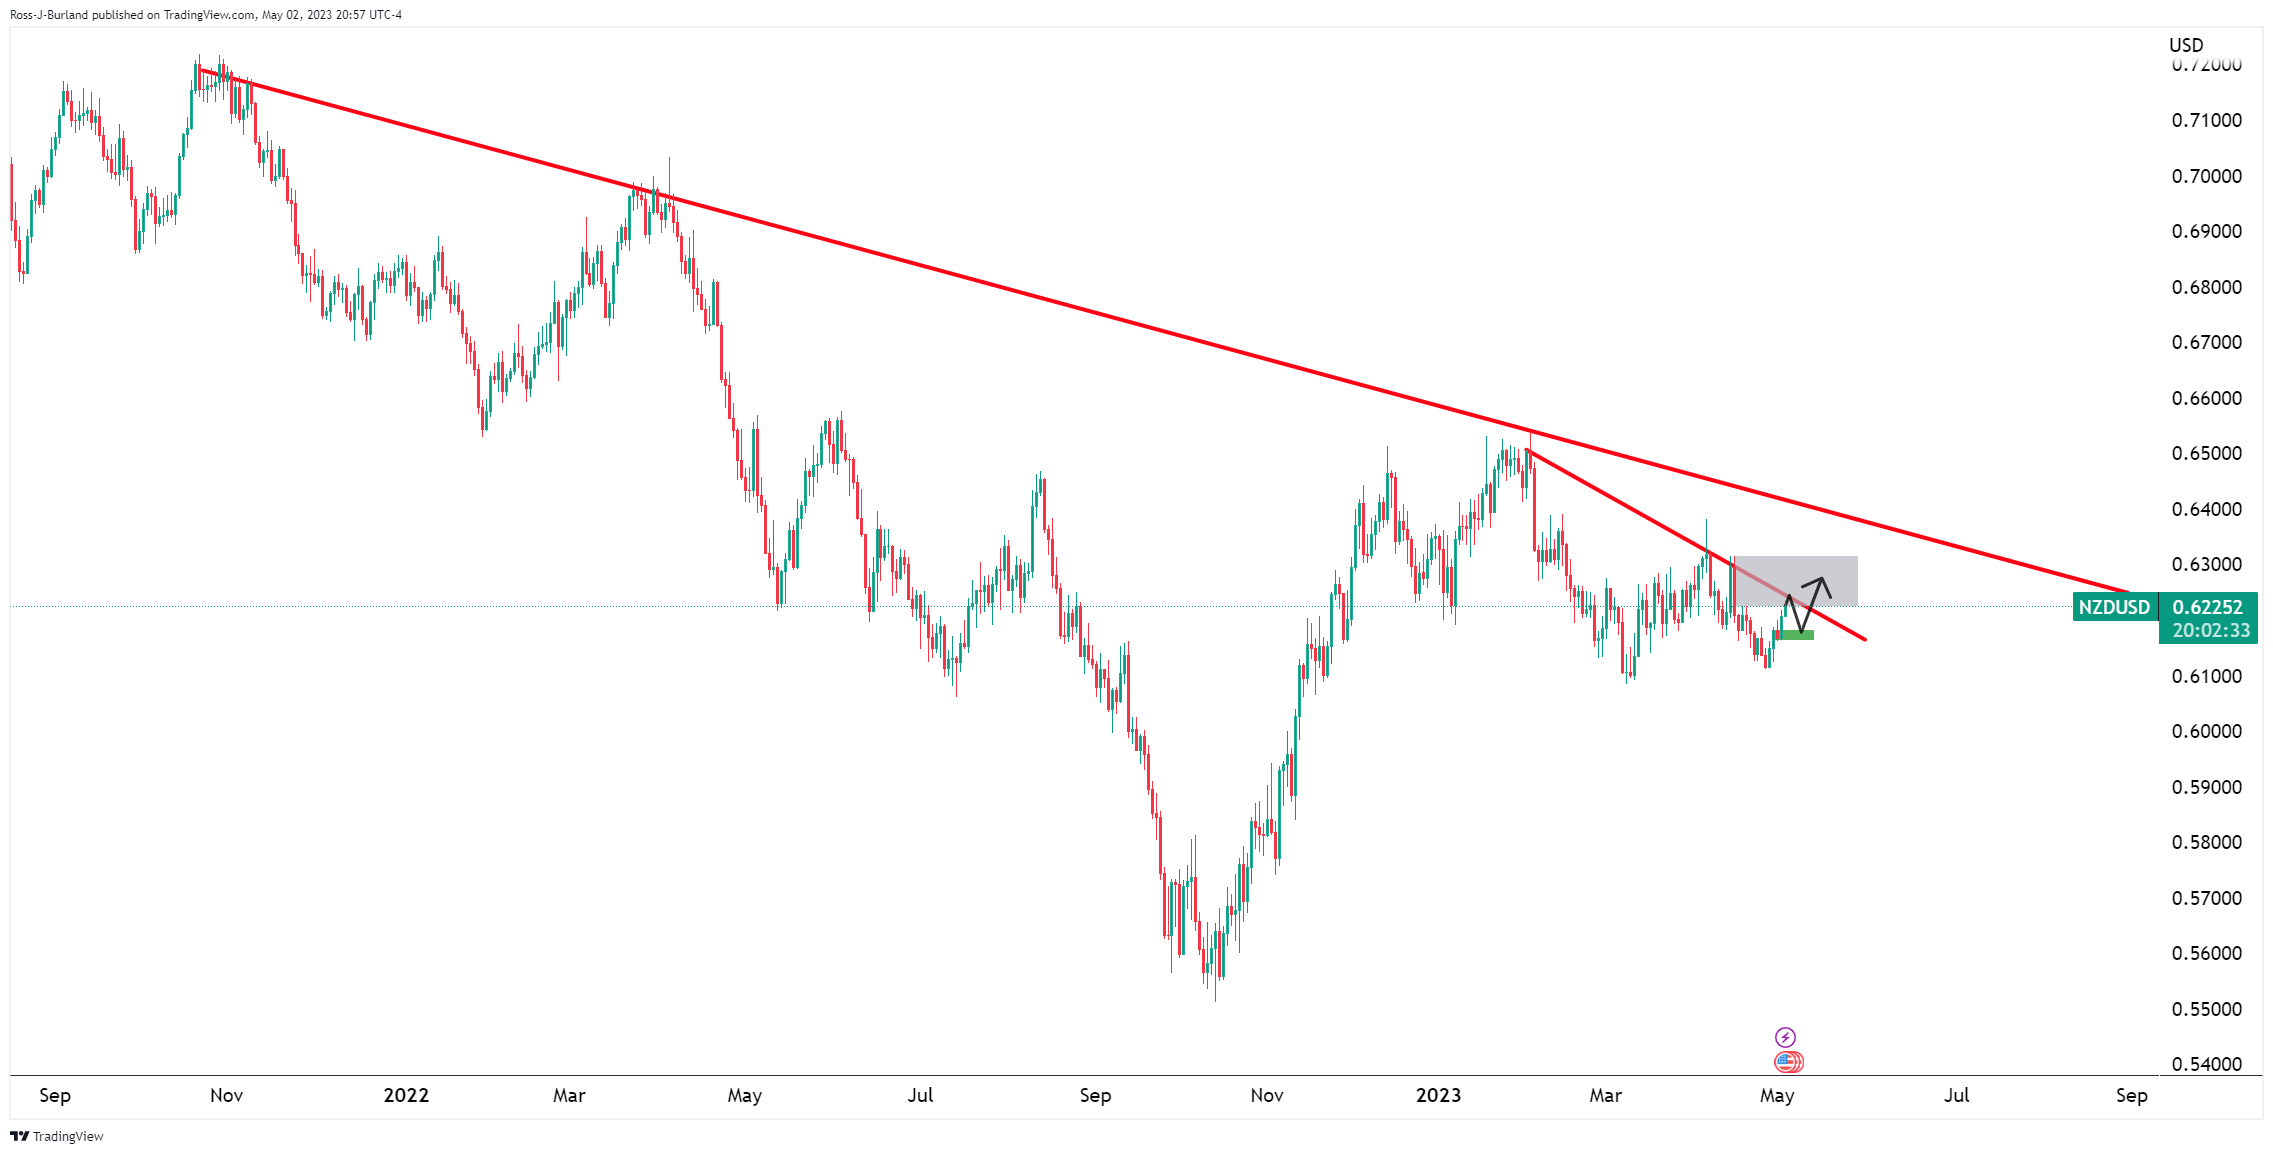
NZD/USD weekly chart
The weekly chart shows the price moving into the neckline resistance area that is below the trendline resistance. A move beyond the neckline leaves the trendline resistance vulnerable.
NZD/USD daily charts
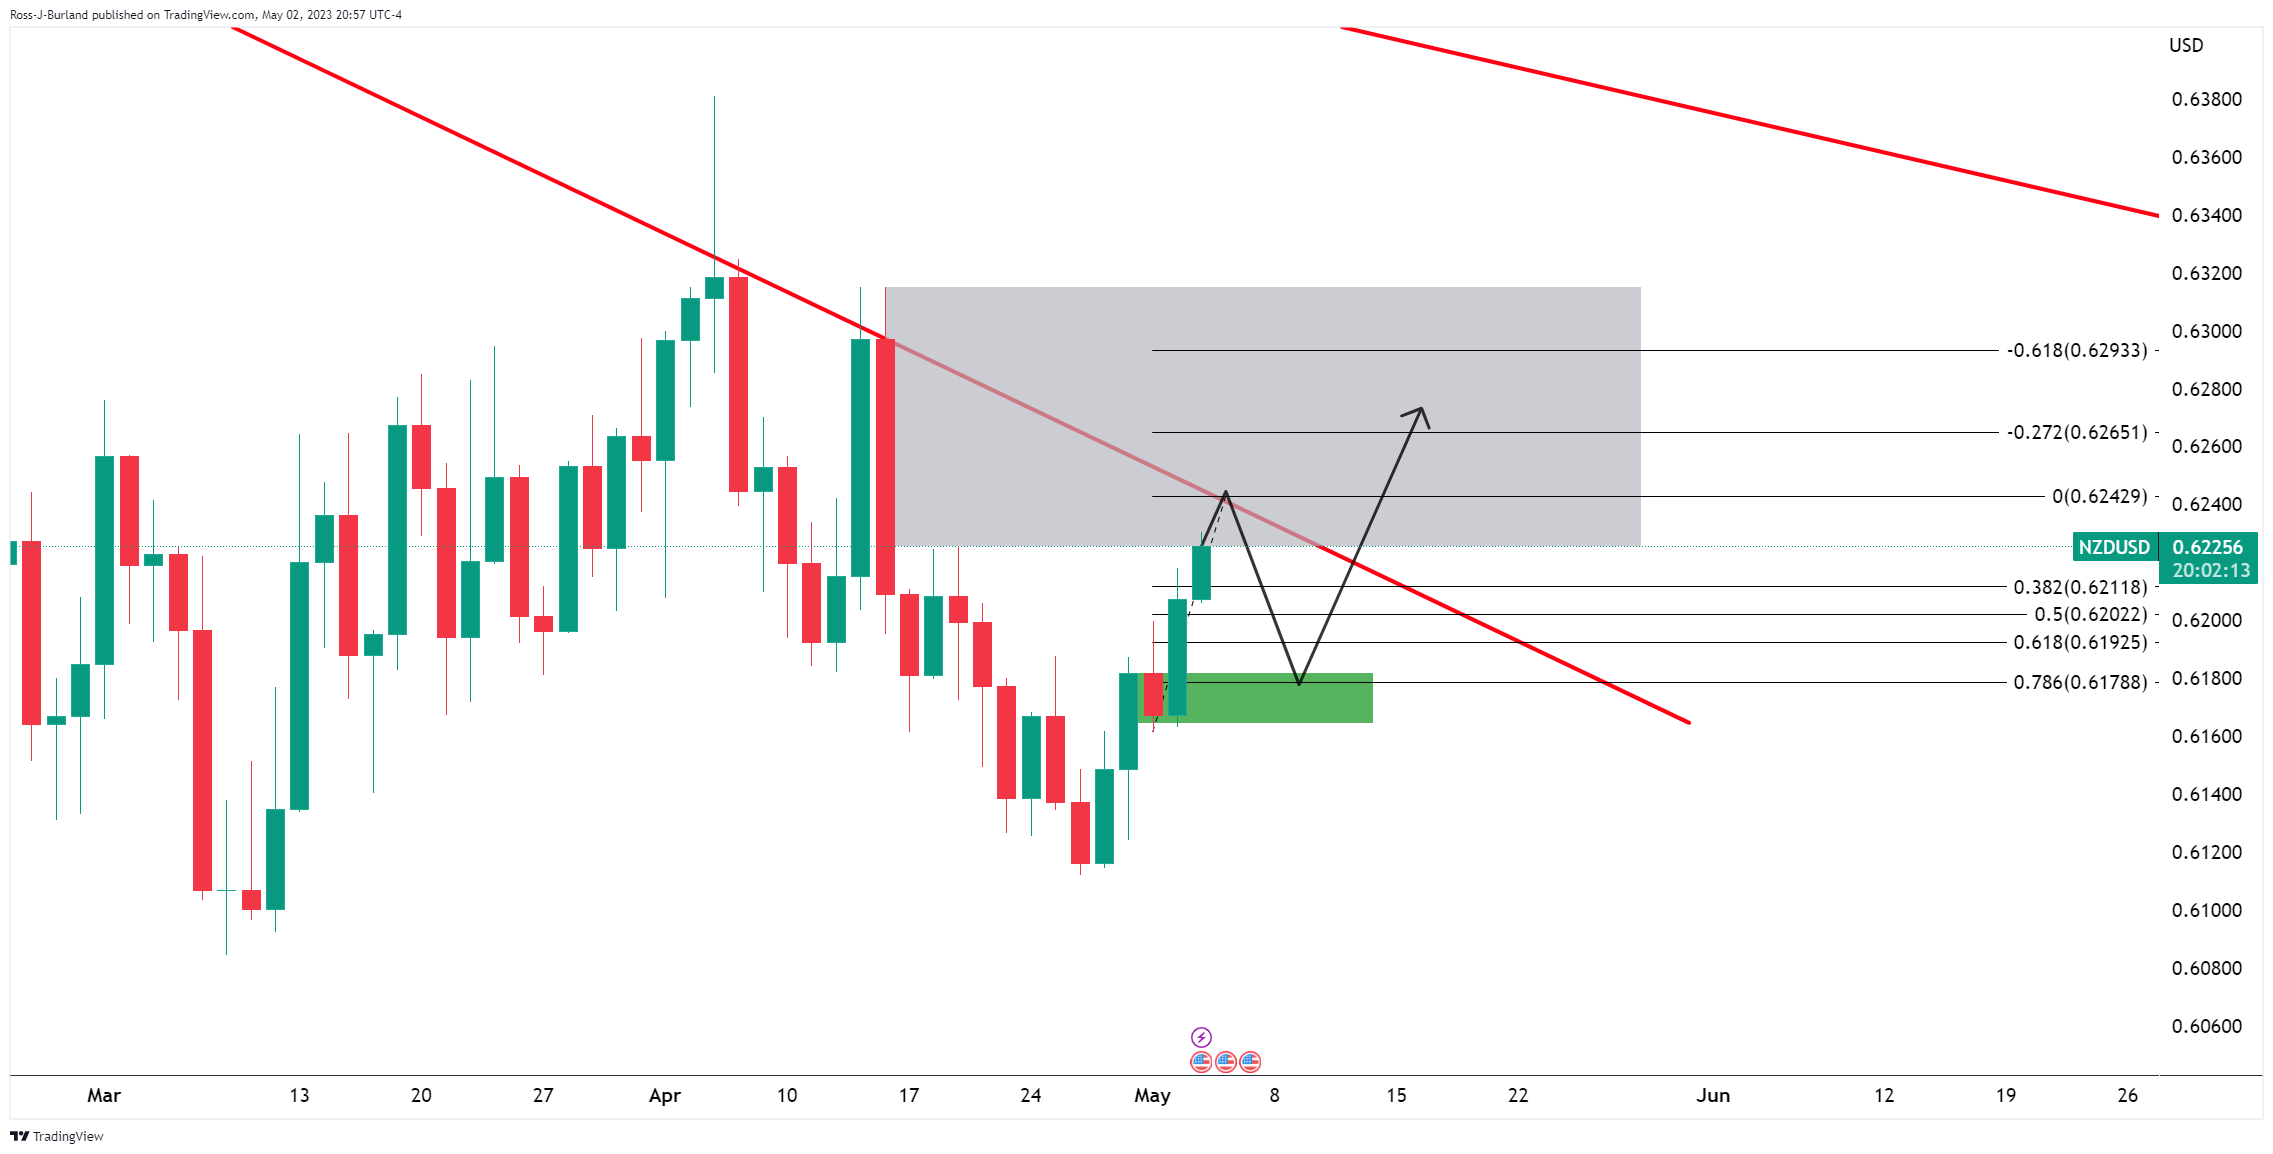
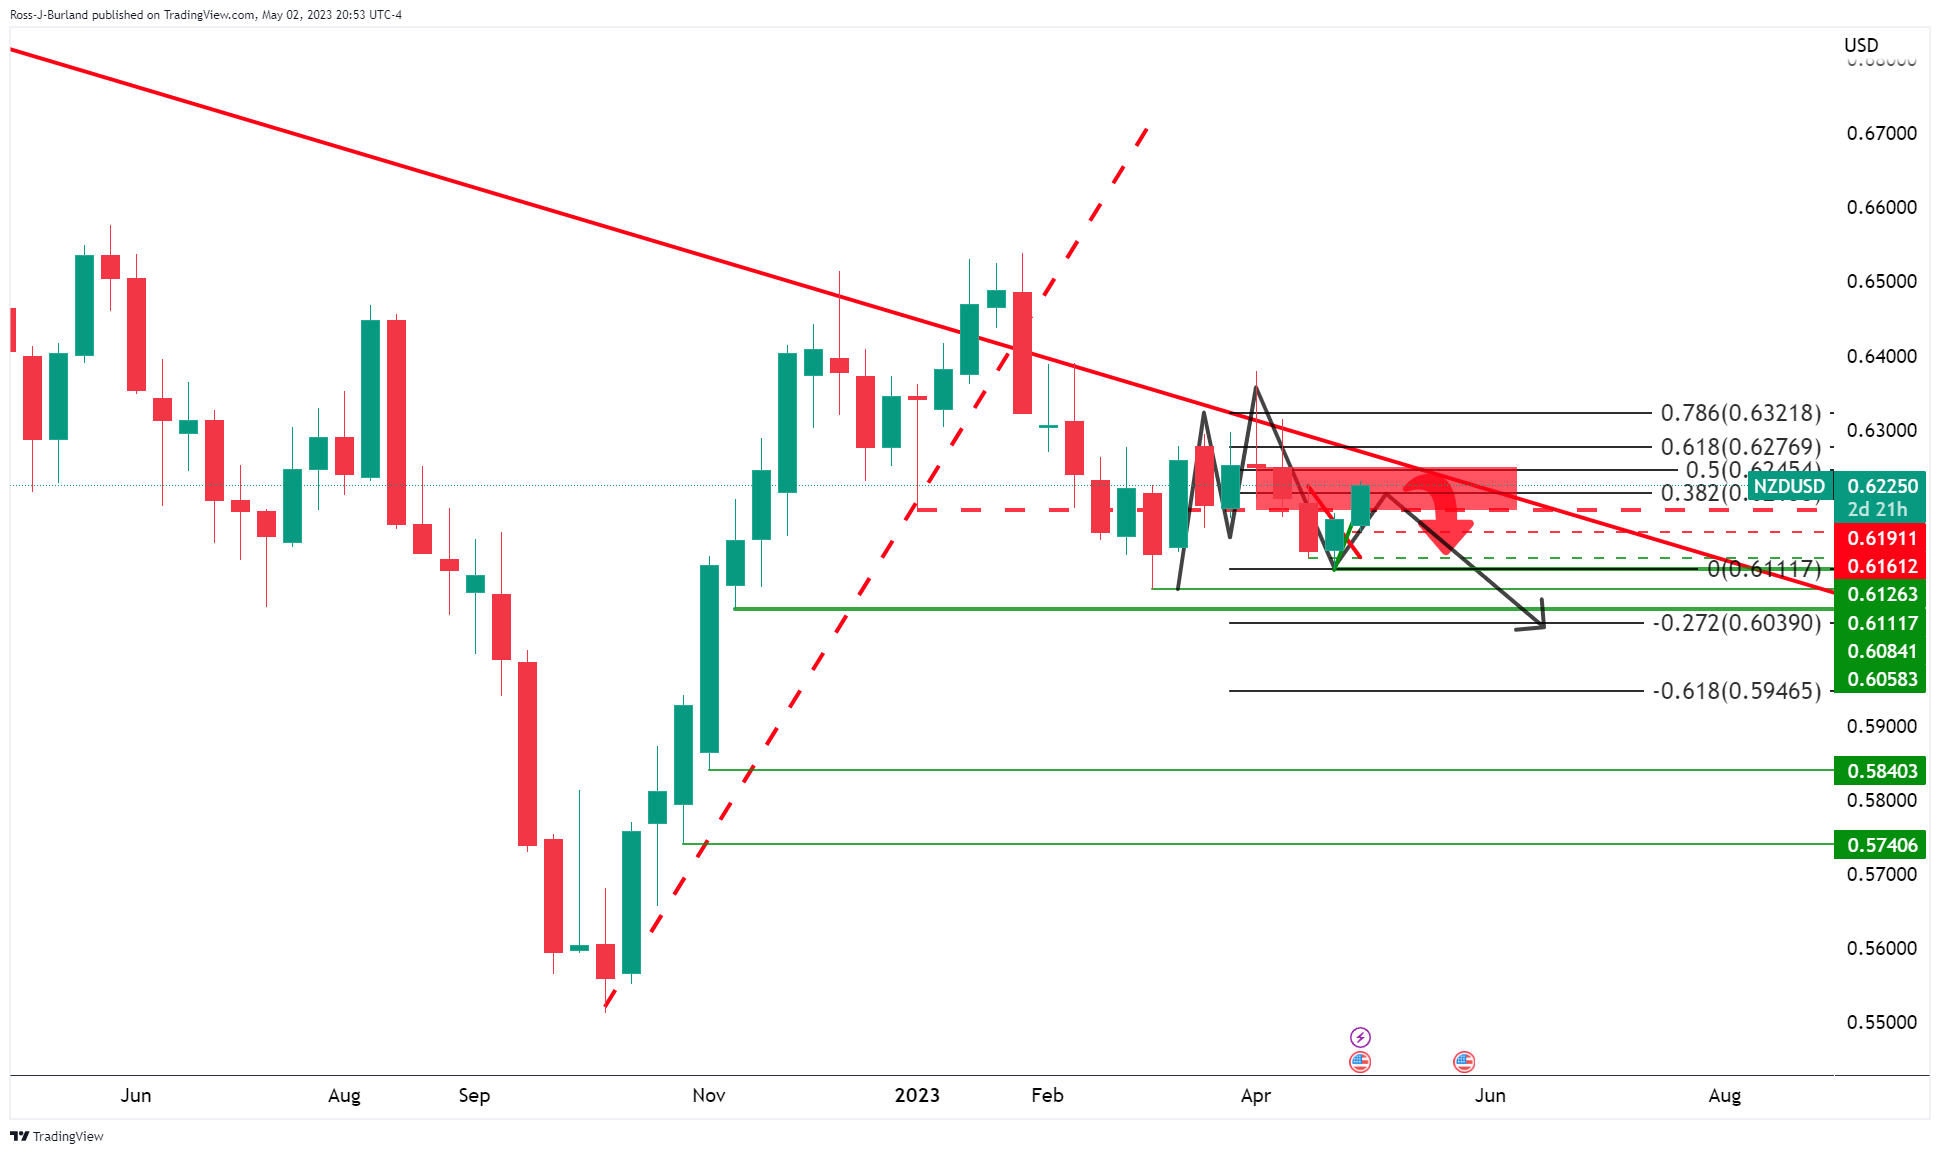
The price is running towards a micro daily trendline resistance but a correction from around the resistance could play out.
NZD/USD H4 chart
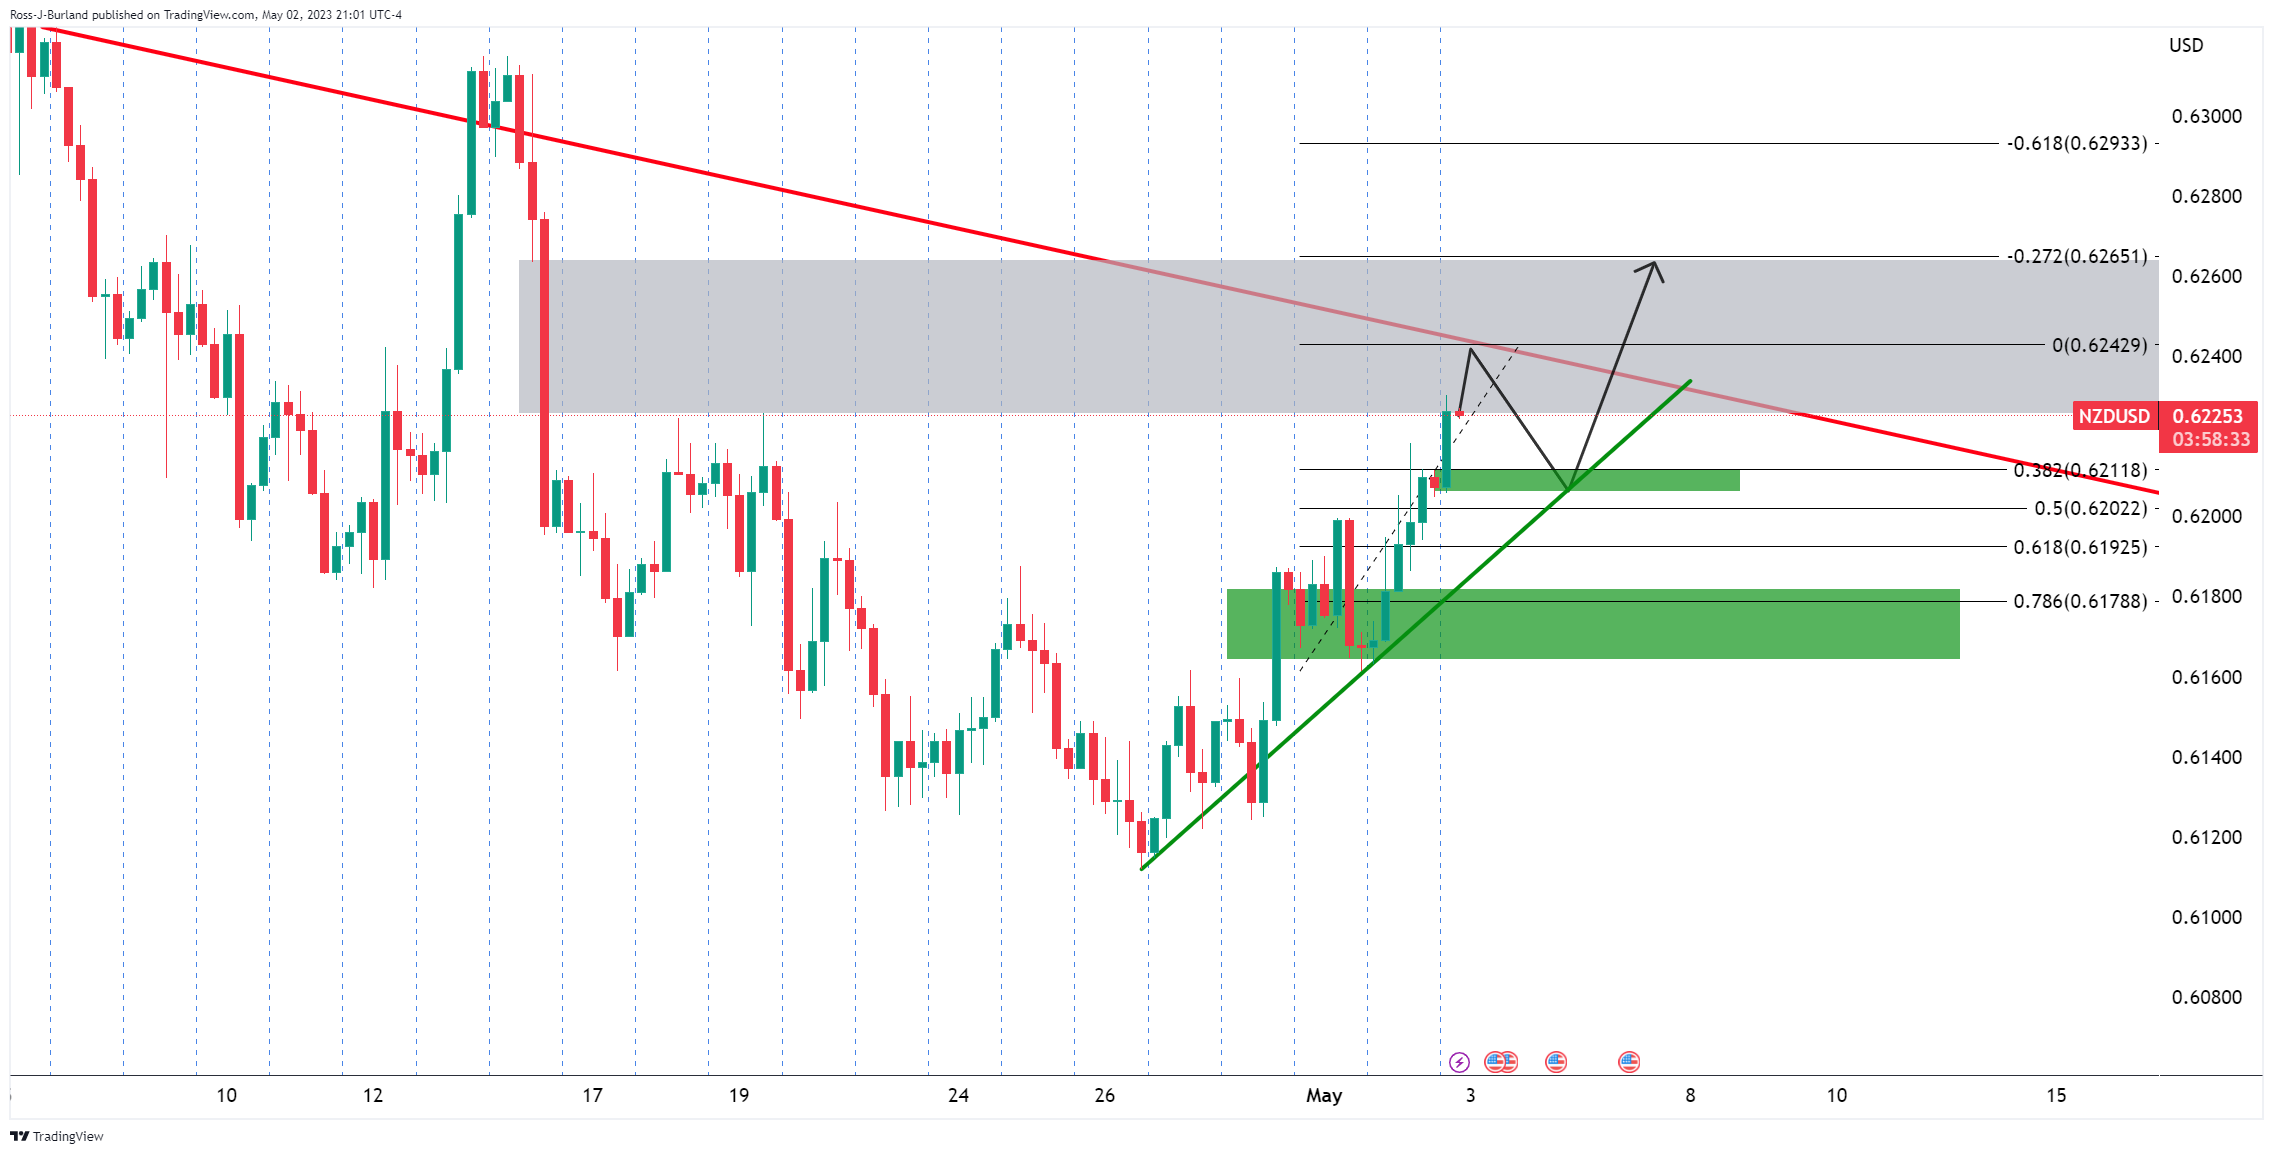
The bears could be looking to target the 38.2% Fibonacci in this regard on a Fibo measurement drawn between the swing lows near 0.6160 and the trendline resistance. There is a price imbalance in the greyed area on the 4-hour chart that could be mitigated if the bulls stay in control.
Author

Ross J Burland
FXStreet
Ross J Burland, born in England, UK, is a sportsman at heart. He played Rugby and Judo for his county, Kent and the South East of England Rugby team.


