|

NZD/USD Price Analysis: Bulls seem tiring near weekly peak above 0.6600

  • NZD/USD drops from 0.6648 after rising for two consecutive days.
  • Overbought RSI conditions, a three-week-old horizontal resistance probe buyers.
  • A falling trend line from July, 200-bar SMA on sellers radars.

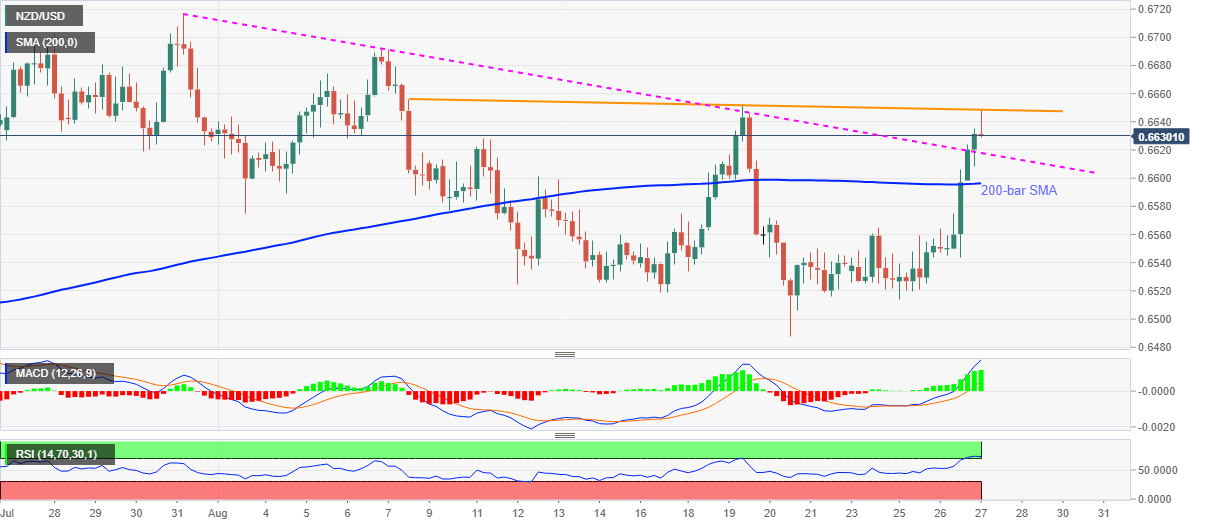
NZD/USD eases from intraday high of 0.6648 to 0.6631 amid the early Thursday’s trading. In doing so, the kiwi pair steps back from one-week high amid overbought RSI conditions.

Other than the overbought RSI conditions, a horizontal area since August 07, surrounding 0.6652/56, also challenge the bulls.

As a result, intraday sellers may aim for the monthly support line, previous resistance, around 0.6615 ahead of 200-bar SMA level near 0.6595.

While bullish MACD suggests the pair’s bounce off any small support, the break of 0.6595 can recall 0.6565 and the 0.6500 threshold back to the chart.

On the upside, a clear break above 0.6656 will need validation from 0.6660 to attack the monthly high of 0.6691.

NZD/USD four-hour chart

Trend: Pullback expected

Additional important levels

Overview
Today last price0.663
Today Daily Change9 pips
Today Daily Change %0.14%
Today daily open0.6621
 
Trends
Daily SMA200.6591
Daily SMA500.656
Daily SMA1000.6364
Daily SMA2000.6375
 
Levels
Previous Daily High0.6624
Previous Daily Low0.6544
Previous Weekly High0.6652
Previous Weekly Low0.6488
Previous Monthly High0.6716
Previous Monthly Low0.644
Daily Fibonacci 38.2%0.6593
Daily Fibonacci 61.8%0.6574
Daily Pivot Point S10.6569
Daily Pivot Point S20.6516
Daily Pivot Point S30.6488
Daily Pivot Point R10.6649
Daily Pivot Point R20.6677
Daily Pivot Point R30.6729

Author

Anil Panchal

Anil Panchal

FXStreet

Anil Panchal has nearly 15 years of experience in tracking financial markets. With a keen interest in macroeconomics, Anil aptly tracks global news/updates and stays well-informed about the global financial moves and their implications.

More from Anil Panchal
Share:

Editor's Picks

EUR/USD looks to regain the 200-day SMA

EUR/USD regains some balance and trade just above 1.1600 the figure ahead of the opening bell in Asia. The pair initially dipped to the 1.1530 zone for the first time since November, always following the stronger US Dollar and the marked flight-to-safety in the context of the ongoing Middle East crisis
 

GBP/USD slips below key averages as geopolitical risks mount

GBP/USD fell about 0.35% on Tuesday, settling around 1.3350 after slipping below the 200-day Exponential Moving Average for the first time since early December. The pair has pulled back sharply from its late-January high near 1.3870, shedding over 500 pips in a series of lower highs and lower lows. 

Gold falls to near $5,100 as inflation fears weigh amidst Middle East conflict

Gold price faces some selling pressure near $5,100 during the early Asian session on Wednesday. The precious metal falls amid a renewed US Dollar demand and dimming prospects for US rate cuts. The US ISM Services Purchasing Managers Index report will be published later on Wednesday. 

Ethereum: Whales step up buying as short positions contract

After holding firm heading into the last weekend, Ethereum whales have returned to action, pouncing on the volatility stemming from escalating military actions between the US and Iran.

Energy shock 2.0: Why rising Gas prices could hit the Euro

Even without a confirmed, sustained disruption, the mere risk to a key global energy chokepoint is enough to inject a significant premium into European Gas markets. And for the Euro, that matters.

Ripple falters amid sell-off jitters and negative funding rates

Ripple (XRP) has come under pressure, drifting lower to $1.35 at the time of writing on Tuesday. The over 2% correction looks poised to erase the previous day’s gains, which lifted the remittance token to $1.42.