|

NZD/USD Price Analysis: Bears keep reins within rising wedge, 0.6190 in the spotlight

  • NZD/USD extends the previous day’s pullback from one-month high inside rising wedge bearish chart pattern.
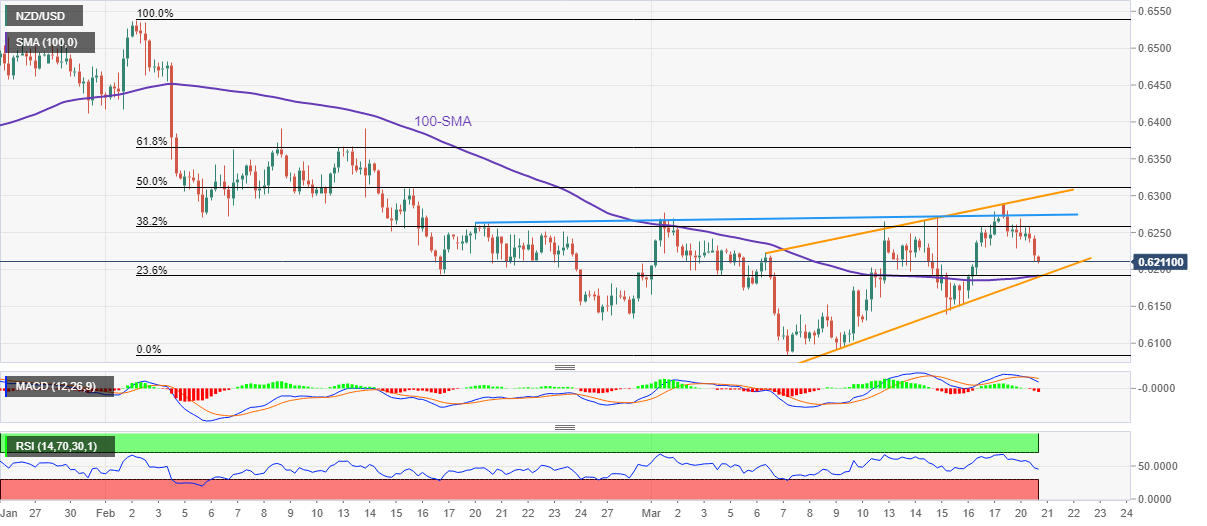
  • Convergence of 100-SMA, wedge’s support and 23.6% Fibonacci retracement highlights 0.6190 level.
  • Bearish MACD signals, failure to cross descending resistance from late February keep Kiwi pair sellers hopeful.

NZD/USD sellers attack a 0.6200 round figure during a two-day downbeat after refreshing the monthly top. Even so, the Kiwi pair stays within a fortnight-old rising wedge bearish chart pattern during early Tuesday in Europe.

Not only the rising wedge but the bearish MACD signals and repeated failures to cross an upward-sloping resistance line from February 20 also keep NZD/USD sellers hopeful.

However, the 100-SMA joins the stated wedge’s lower line and 23.6% Fibonacci retracement of the pair’s February-March fall to highlight 0.6190 as a tough nut to crack for the bears.

In a case where the quote successfully breaks the 0.6190 support confluence, the odds of witnessing a slump toward the theoretical target surrounding the 0.6000 psychological magnet can’t be ruled out.

During the anticipated fall, the 0.6100 threshold and the monthly low of 0.6084 can act as buffers.

Meanwhile, recovery moves may initially aim for the 38.2% Fibonacci retracement level of 0.6257 before challenging the aforementioned monthly resistance line, near 0.6275 by the press time.

Even so, the NZD/USD pair sellers remain hopeful unless the quote stays below the aforementioned wedge’s top line, close to 0.6300 as we write.

Overall, NZD/USD remains on the bear’s radar but the pair’s further downside hinges on a 0.6190 breakdown.

NZD/USD: Four-hour chart

Trend: Further downside expected

Additional important levels

Overview
Today last price0.6212
Today Daily Change-0.0034
Today Daily Change %-0.54%
Today daily open0.6246
 
Trends
Daily SMA200.6194
Daily SMA500.631
Daily SMA1000.6267
Daily SMA2000.6162
 
Levels
Previous Daily High0.6289
Previous Daily Low0.6228
Previous Weekly High0.6278
Previous Weekly Low0.6131
Previous Monthly High0.6538
Previous Monthly Low0.6131
Daily Fibonacci 38.2%0.6251
Daily Fibonacci 61.8%0.6266
Daily Pivot Point S10.622
Daily Pivot Point S20.6193
Daily Pivot Point S30.6159
Daily Pivot Point R10.6281
Daily Pivot Point R20.6316
Daily Pivot Point R30.6342

Author

Anil Panchal

Anil Panchal

FXStreet

Anil Panchal has nearly 15 years of experience in tracking financial markets. With a keen interest in macroeconomics, Anil aptly tracks global news/updates and stays well-informed about the global financial moves and their implications.

More from Anil Panchal
Share:

Markets move fast. We move first.

Orange Juice Newsletter brings you expert driven insights - not headlines. Every day on your inbox.

By subscribing you agree to our Terms and conditions.

Editor's Picks

EUR/USD recovers to 1.1750 region as 2025 draws to a close

Following the bearish action seen in the European session on Wednesday, EUR/USD regains its traction and recovery to the 1.1750 region. Nevertheless, the pair's volatility remains low as trading conditions thin out on the last day of the year.

GBP/USD stays weak near 1.3450 on modest USD recovery

GBP/USD remains under modest beairsh pressure and fluctuates at around 1.3450 on Wednesday. The US Dollar finds fresh demand due to the end-of-the-year position adjustments, weighing on the pair amid the pre-New Year trading lull. 

Gold retreats to $4,300 area, looks to post monthly gains

Gold stays on the back foot on the last day of 2025 and trades near $4,300, possibly pressured by profit-taking and position adjustments. Nevertheless, XAU/USD remains on track to post gains for December and extend its winning streak into a fifth consecutive month.

Bitcoin, Ethereum and XRP prepare for a potential New Year rebound

Bitcoin, Ethereum, and Ripple are holding steady on Wednesday after recording minor gains on the previous day. Technically, Bitcoin could extend gains within a triangle pattern while Ethereum and Ripple face critical overhead resistance. 

Economic outlook 2026-2027 in advanced countries: Solidity test

After a year marked by global economic resilience and ending on a note of optimism, 2026 looks promising and could be a year of solid economic performance. In our baseline scenario, we expect most of the supportive factors at work in 2025 to continue to play a role in 2026.

Crypto market outlook for 2026

Year 2025 was volatile, as crypto often is.  Among positive catalysts were favourable regulatory changes in the U.S., rise of Digital Asset Treasuries (DAT), adoption of AI and tokenization of Real-World-Assets (RWA).