|

NZD/USD Price Analysis: 21-day SMA guards immediate upside

  • NZD/USD consolidates the previous day’s losses, maintains the U-turn from 21-day SMA.
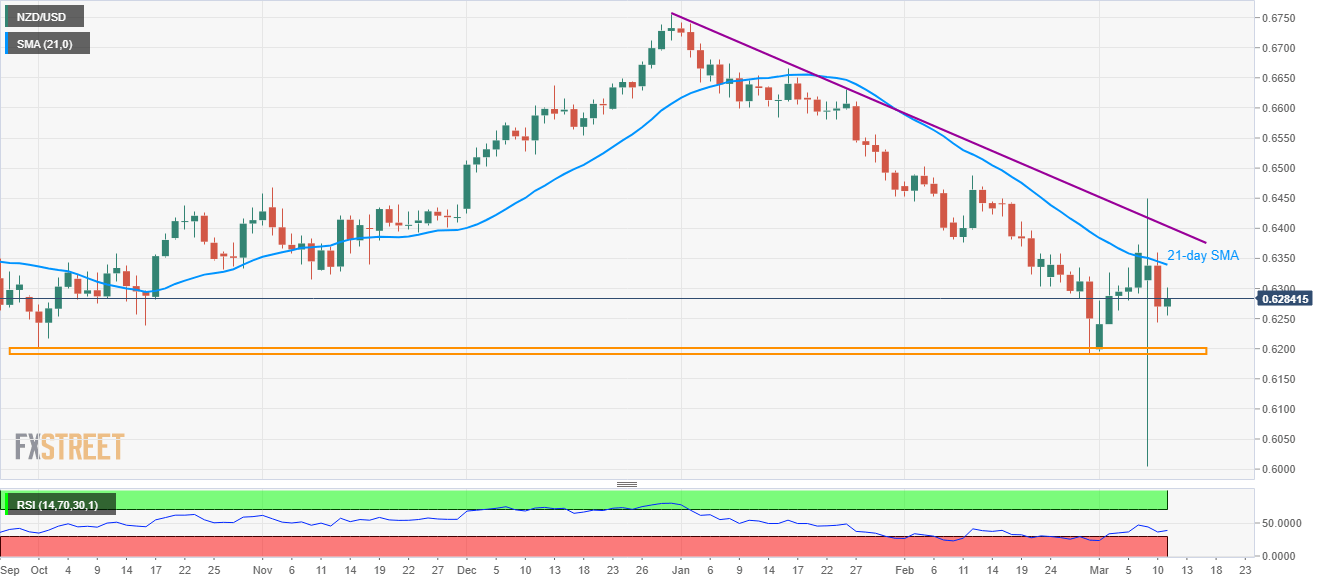
  • A horizontal area comprising November and February lows acts as the key support.

Following its another decline from 21-day SMA, NZD/USD retraces 0.15% to 0.6283 during early Wednesday.

In addition to the 21-day SMA level of 0.6340, a downward sloping trend line since December 31, 2019, currently around 0.6400, also acts as the key resistance.

If at all buyers manage to extend the recovery gains beyond 0.6400 on a daily closing basis, they confirm the broad descending triangle’s break, which in turn can propel the run-up towards the early-January lows surrounding 0.6600.

Meanwhile, 0.6240 can act as immediate support ahead of the 0.6200/6190 horizontal region.

Should there be a further downside past-0.6190, the quote can revisit the Monday’s flash crash low near 0.6000.

NZD/USD daily chart

Trend: Bearish

Additional important levels

Overview
Today last price0.6282
Today Daily Change12 pips
Today Daily Change %0.19%
Today daily open0.627
 
Trends
Daily SMA200.6342
Daily SMA500.6478
Daily SMA1000.6481
Daily SMA2000.6481
 
Levels
Previous Daily High0.636
Previous Daily Low0.6243
Previous Weekly High0.6373
Previous Weekly Low0.6195
Previous Monthly High0.6504
Previous Monthly Low0.6192
Daily Fibonacci 38.2%0.6288
Daily Fibonacci 61.8%0.6315
Daily Pivot Point S10.6222
Daily Pivot Point S20.6174
Daily Pivot Point S30.6105
Daily Pivot Point R10.6339
Daily Pivot Point R20.6408
Daily Pivot Point R30.6456

Author

Anil Panchal

Anil Panchal

FXStreet

Anil Panchal has nearly 15 years of experience in tracking financial markets. With a keen interest in macroeconomics, Anil aptly tracks global news/updates and stays well-informed about the global financial moves and their implications.

More from Anil Panchal
Share:

Editor's Picks

EUR/USD treads water above 1.1850 amid thin trading

EUR/USD stays defensive but holds 1.1850 amid quiet markets in the European hours on Monday.  The US Dollar is struggling for direction due to thin liquidity conditions as US markets are closed in observance of Presidents' Day. 

GBP/USD flat lines as traders await key UK and US macro data

GBP/USD kicks off a new week on a subdued note and oscillates in a narrow range near 1.365 in Monday's European trading. The mixed fundamental backdrop warrants some caution for aggressive traders as the market focus now shifts to this week's important releases from the UK and the US.

Gold sticks to intraday losses; lacks follow-through

Gold remains depressed through the early European session on Monday, though it has managed to rebound from the daily trough and currently trades around the $5,000 psychological mark. Moreover, a combination of supporting factors warrants some caution for aggressive bearish traders, and before positioning for deeper losses.

Bitcoin consolidates as on-chain data show mixed signals

Bitcoin price has consolidated between $65,700 and $72,000 over the past nine days, with no clear directional bias. US-listed spot ETFs recorded a $359.91 million weekly outflow, marking the fourth consecutive week of withdrawals.

The week ahead: Key inflation readings and why the AI trade could be overdone

It is likely to be a quiet start to the week, with US markets closed on Monday for Presidents Day. European markets are higher across the board and gold is clinging to the $5,000 level after the tamer than expected CPI report in the US reduced haven flows to precious metals.

Monero Price Forecast: XMR risks a drop below $300 under mounting bearish pressure

Monero (XMR) starts the week under pressure, recording a 4% decline at press time on Monday after a 7% drop the previous day, putting the $300 support zone in focus.