NZD/USD bulls running out of steam at 0.7260 wall
- The NZD/USD is forming a head and shoulder pattern on the 1-hour chart.
- The RBNZ leaves the rate unchanged at 1.75% for 16 months in a row.

The NZD/USD is trading at around 0.7228 virtually unchanged on the day so far as the market is digesting yesterday’s Fed rate hike. While most participants where very upbeat and expecting four rates in 2018, the market was disappointed and preferred selling the US dollar across the board.
In a note, Peter Hooper from Deutsche Bank insists on the importance of wage inflation to justify hiking rates: “The Committee (FOMC) is likely going to need to see evidence that wage and price inflation are picking up meaningfully before becoming concerned about significant overheating associated with the tightening labor market.”
On the Kiwi side of the news, this Wednesday a little after the Fed, the Reserve Bank of New Zealand decided to leave interest rates at a record low at 1.75% for a 16 month in a row. Additionally, Adrian Orr will be appointed as Reserve Bank Governor, effective from March,27.
Capital Economics analysts say that Orr might provide change at the RBNZ: “RBNZ Governor Grant Spencer finished his six-month term without any fireworks … reiterating that rates are unlikely to rise until the second half of 2019. The new Governor Adrian Orr is unlikely to begin with a bang when he takes over on Tuesday, not least because he will have to deal with a slowing economy and not enough inflation, but we can’t completely dismiss the possibility that he shakes things up a little.”
According to ANZ, the RBNZ will have to hike at some point: “With inflation ‘forecast to trend upwards’ over the medium term (looking through an expected near-term weakening) the RBNZ is treading water with regards to monetary policy … The RBNZ’s next move is expected to be a hike, but the RBNZ is being careful to not give that signal prematurely, given the market’s tendency to pre-empt.”
NZD/USD daily chart:
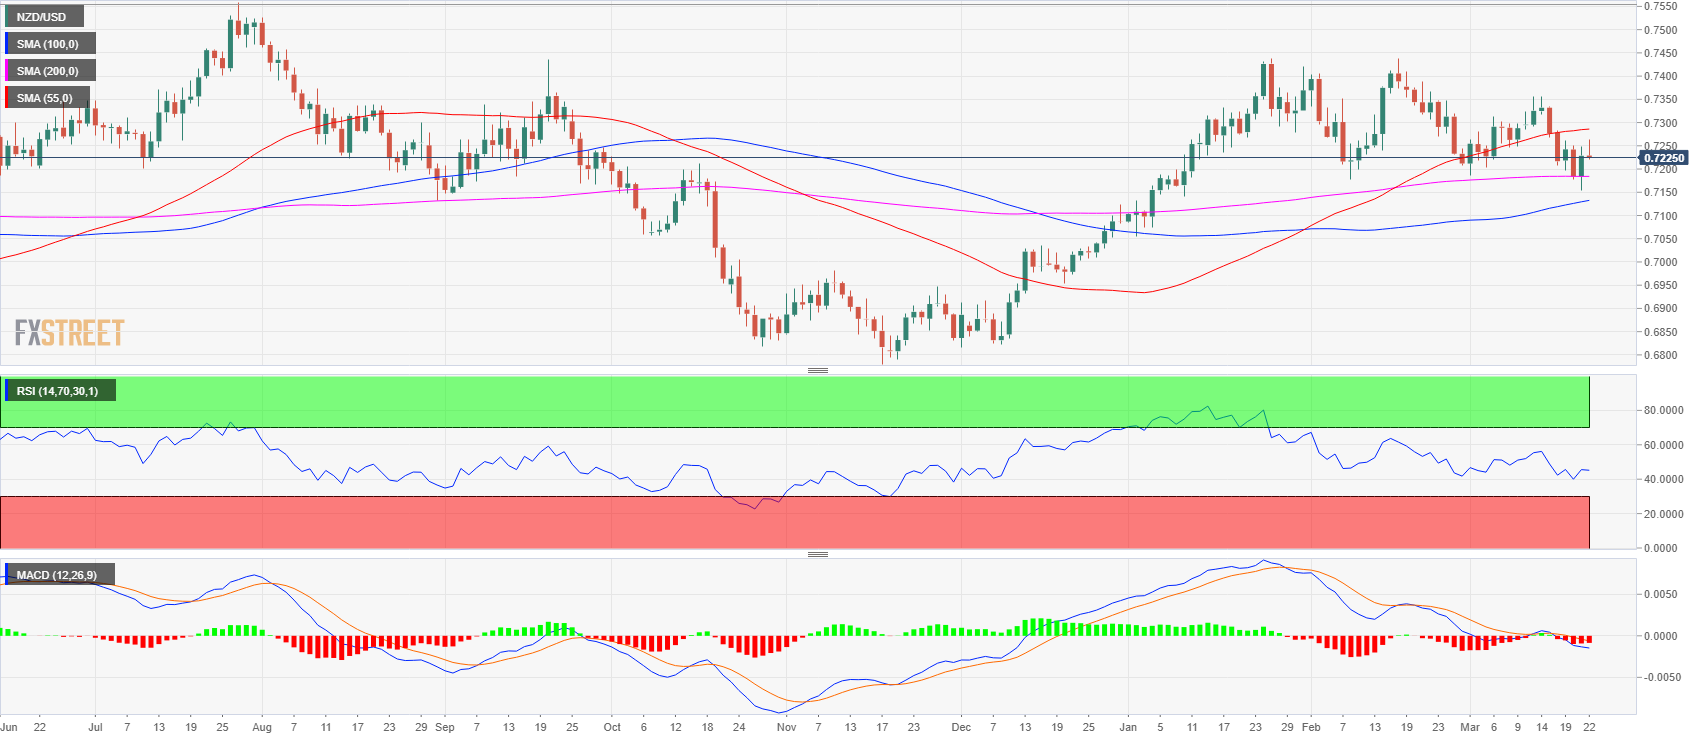
The NZD/USD bounced Wednesday after establishing a low at 0.7154. Buyers tried to lift the market up on Thursday but the price is currently back int yesterday’s range. On the daily chart the bulls are losing momentum as the market is trading below its 55-period simple moving average and the MACD indicator is bearishly configured.
NZD/USD 1-hour chart
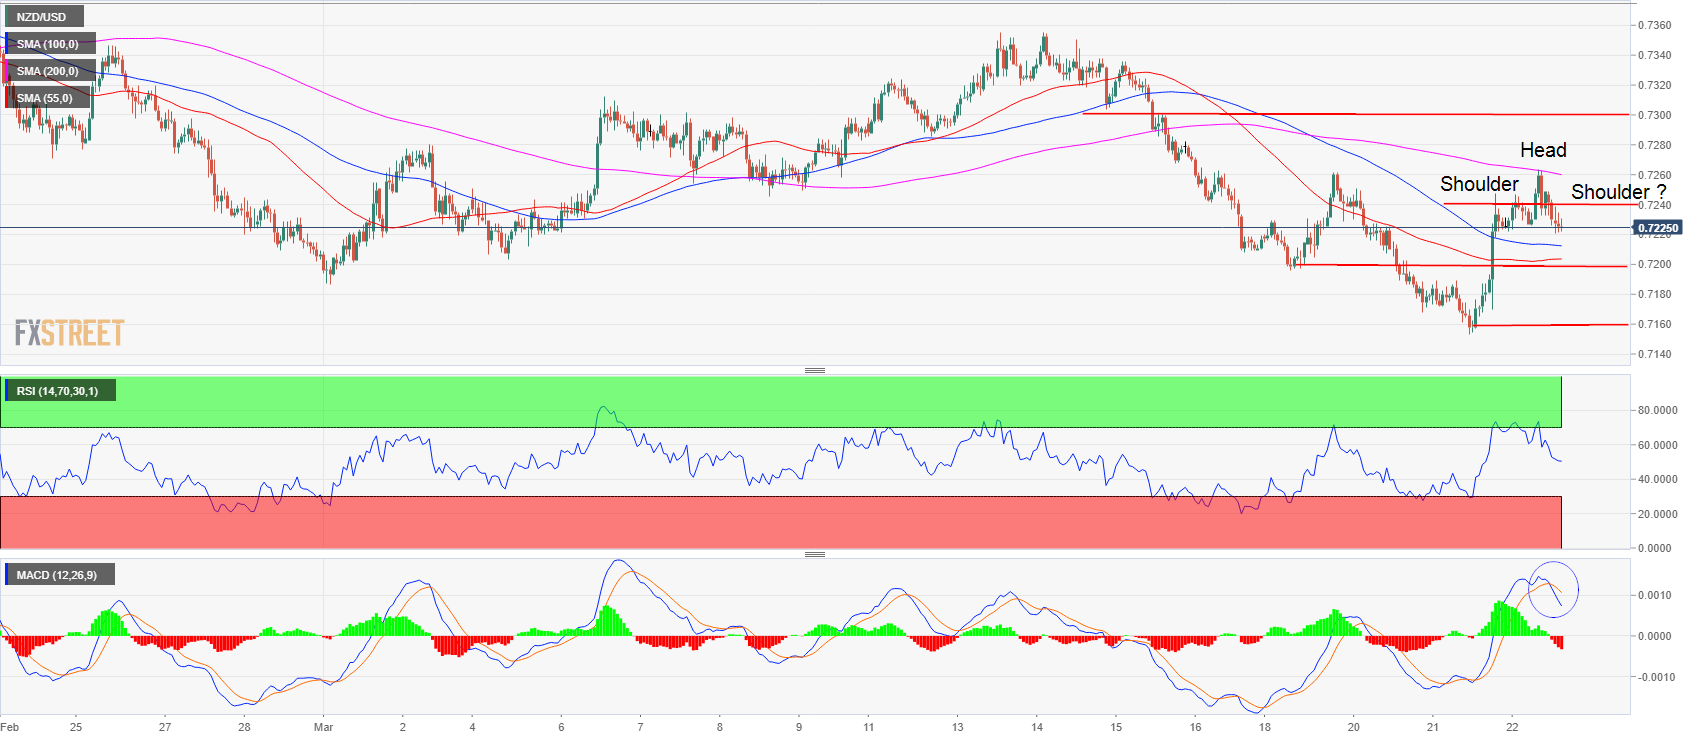
The NZD/USD found resistance at the 200-period simple moving average on the 60-minute chart. Investors are weighing whether yesterday’s move up was an over-reaction to the Fed announcing only three rate hikes in 2018. Support is seen at 0.7200 which has been major pivots those last months; followed by 0.7154 which is yesterday’s low. Intraday resistance is then seen at 0.7240 where the market will try to create a head and shoulder pattern; followed by the high of the day 40 pips higher at 0.7260. If the level is broken to the upside we can look at the 0.7300 supply level.
Author

Flavio Tosti
Independent Analyst
















