NZD/USD bears taking a bite out of bullish structure
- NZD/USD is taking out a key level and printing fresh lows within a bearish schematic.
- should the bulls move in now, then there will be prospects of a restest of prior structures near 0.6355 and 0.6375 above.

NZD/USD has been chipping away at the downside in Asia, sliding to a fresh session low at the time of writing, down 0.35% on the day so far after dropping from a high of 0.6365. The US Dollar has been struggling to break higher which had been giving the commodity complex some room to breathe but the tables are turning.
The greenback came under pressure in recent weeks as investors expect a pivot from the Federal Reserve sooner than later. This had been supporting the Kiwi. However, a combination of a poor start on Wall Street on Monday and dismal domestic data is impacting the currency at the start of this week.
New Zealand Business confidence has plummeted to a fresh record low in December, down 13 points to -70. Expected own activity fell from -14 to -26. Analysts at ANZ Bank said that the ''Reserve Bank of New Zealand appears to have achieved shock value with its sharp increase in the OCR, hawkish forecasts, and warning of deliberate recession in 2023. Many indicators are around Global Financial Crisis (GFC) lows. Inflation pressures remain intense. Wage expectations jumped.''
Meanwhile, high beta currencies, such as NZD, were pressured on the back of US stocks closing sharply lower to extend their three-day losing streak on Monday and Treasury yields advanced. Given the time of year, there will be few catalysts to dissuade risk-off sentiment in the low-volume, the pre-holiday week which could lead to further downside in what appears to be a fresh bearish cycle given the recent break of trendline support as the following illustrates.
NZD/USD technical analysis
As per the earlier analysis, NZD/USD Price Analysis: Bears attempt to take control at a key support structure at 0.6340, the bird is making headway to the downside.
It was stated that the bears would not in the clear until a change of structure in the 4-hour time frame and this required a break of 0.6340:
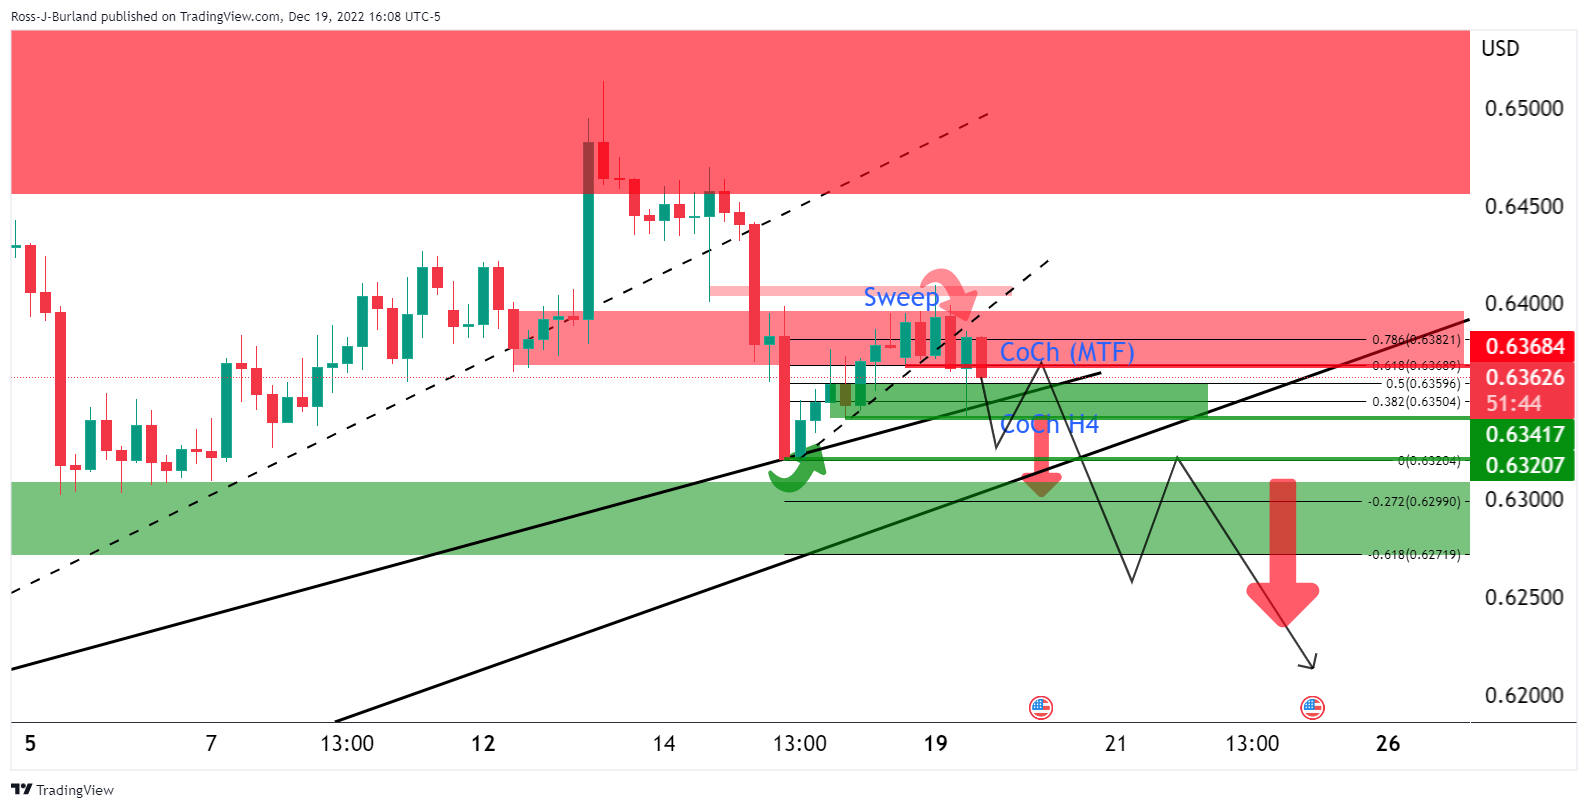
Moving to the 15-min charts to monitor for tests of this area...
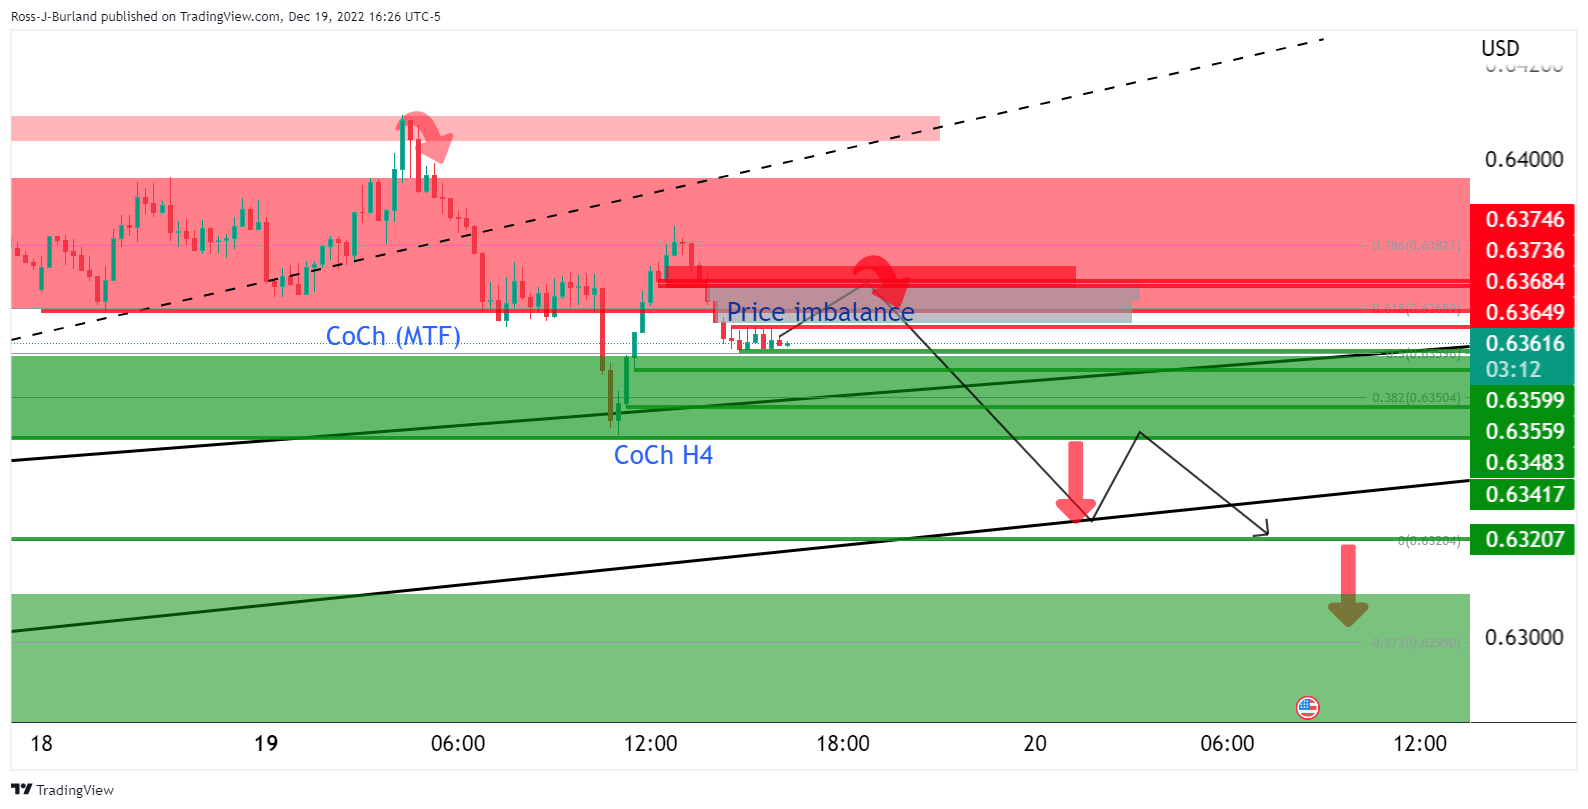
The prior analysis above illustrated the market structure in more detail.
NZD/USD update, M15 chart
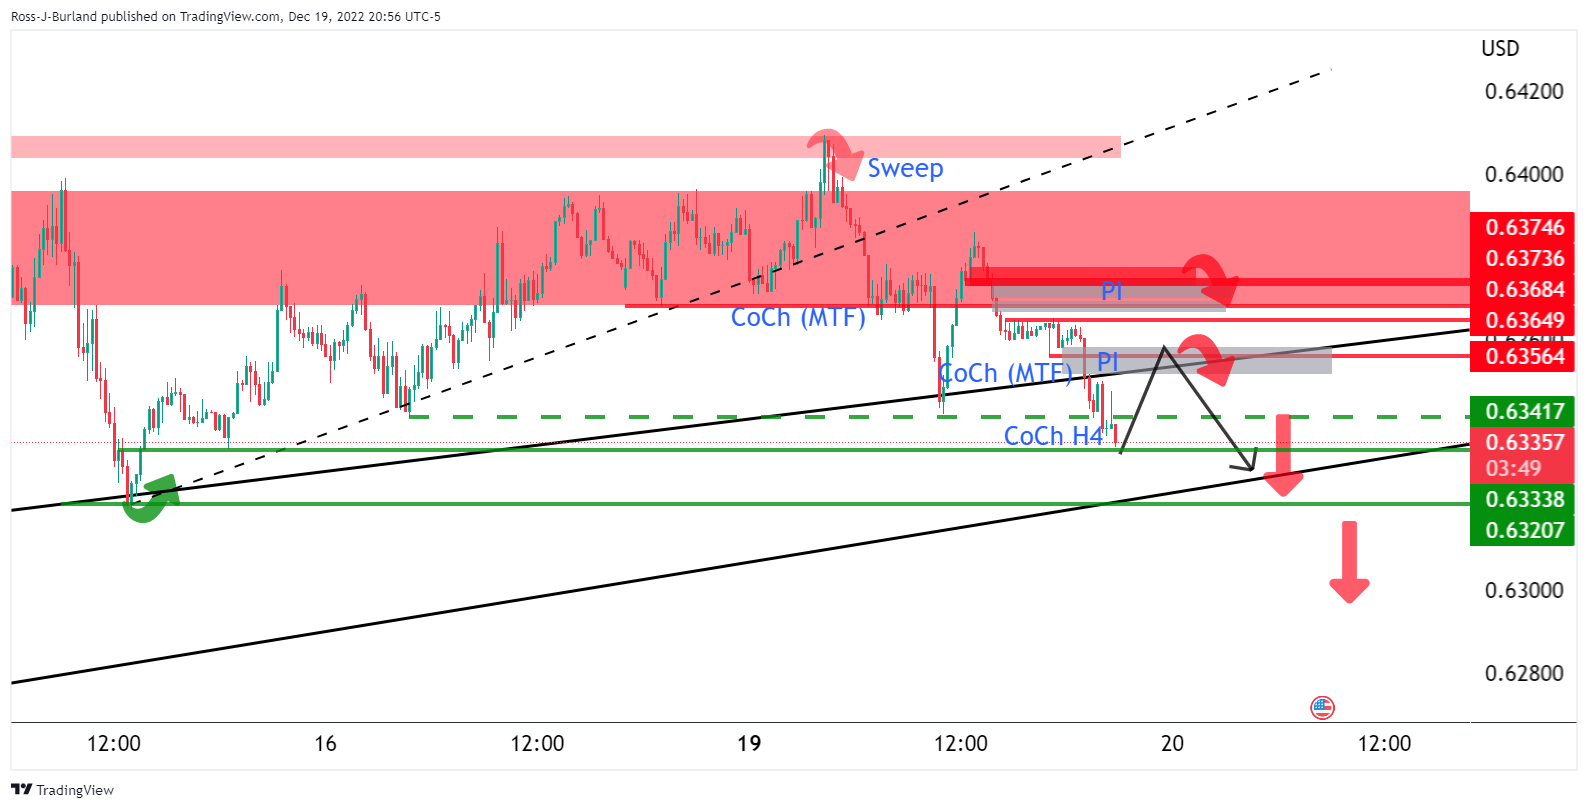
The price is taking out the trendline support and the horizontal 0.6340 level while printing fresh lows within this bearish schematic. However, should the bulls move in now, then there will be prospects of a restest of prior structures namely where the price imbalances are situated around 0.6355 and 0.6375 above. If either of these structures were to hold, the bias will remains to the downside for a run to test 0.6320.
Author

Ross J Burland
FXStreet
Ross J Burland, born in England, UK, is a sportsman at heart. He played Rugby and Judo for his county, Kent and the South East of England Rugby team.


