|

NZD/JPY Price Analysis: Sideways movement continues with bearish tone

  • NZD/JPY pair remains directionless, showing a lack of clear upward or downward momentum.
  • Sellers maintain some control as the pair remains below its 20-day Simple Moving Average.

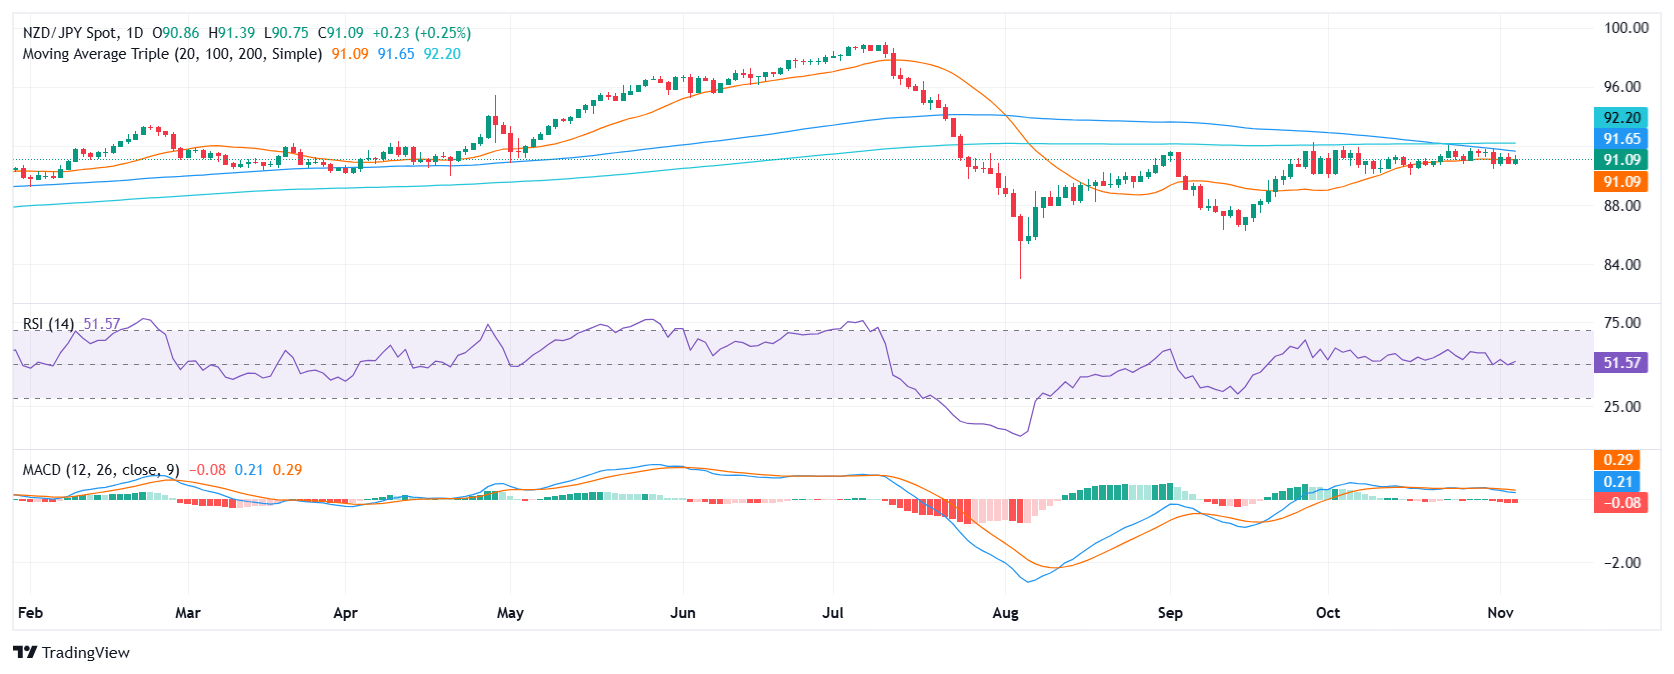
The NZD/JPY pair has been trading sideways over the past sessions, consolidating within a range and rose to 91.10 on Tuesday. Bears continue to win small battles and are slowly pushing the cross below the 20-day Simple Moving Average (SMA). 

The Moving Average Convergence Divergence (MACD) histogram presents rising red bars, indicating increasing selling pressure. However, the Relative Strength Index (RSI) is rising from the midpoint, suggesting a potential recovery in buying momentum. Overall, the technical outlook for NZD/JPY remains mixed, with no clear trend emerging but with some selling signals emerging.

Traders can closely monitor key support and resistance levels to gauge market sentiment. Support levels currently stand at 91.00, 90.70 and 90.30, while resistance levels reside at 91.30, 91.50, and 92.00.

The prevailing range-bound movement aligns with the mixed technical outlook, indicating indecision in the market. Until a clear break above or below these support and resistance levels occurs, the sideways movement is likely to continue.

NZD/JPY daily chart

Author

Patricio Martín

Patricio is an economist from Argentina passionate about global finance and understanding the daily movements of the markets.

More from Patricio Martín
Share:

Markets move fast. We move first.

Orange Juice Newsletter brings you expert driven insights - not headlines. Every day on your inbox.

By subscribing you agree to our Terms and conditions.

Editor's Picks

EUR/USD struggles for direction amid USD gains

EUR/USD is trimming part of its earlier gains, coming under some mild downside pressure near 1.1730 as the US Dollar edges higher. Markets are still digesting the Fed’s latest rate decision, while also looking ahead to more commentary from Fed officials in the sessions ahead.

GBP/USD drops to daily lows near 1.3360

Disappointing UK data weighed on the Sterling towards the end of the week, triggering a pullback in GBP/USD to fresh daily lows near 1.3360. Looking ahead, the next key event across the Channel is the BoE meeting on December 18.

Gold losses momentum, challenges $4,300

Gold now gives away some gains and disputes the key $4,300 zone per troy ounce following earlier multi-week highs. The move is being driven by expectations that the Fed will deliver further rate cuts next year, with the yellow metal climbing despite a firmer Greenback and rising US Treasury yields across the board.

Litecoin Price Forecast: LTC struggles to extend gains, bullish bets at risk

Litecoin (LTC) price steadies above $80 at press time on Friday, following a reversal from the $87 resistance level on Wednesday. Derivatives data suggests a bullish positional buildup while the LTC futures Open Interest declines, flashing a long squeeze risk.

Big week ends with big doubts

The S&P 500 continued to push higher yesterday as the US 2-year yield wavered around the 3.50% mark following a Federal Reserve (Fed) rate cut earlier this week that was ultimately perceived as not that hawkish after all. The cut is especially boosting the non-tech pockets of the market.

Aave Price Forecast: AAVE primed for breakout as bullish signals strengthen

Aave (AAVE) price is trading above $204 at the time of writing on Friday and approaching the upper boundary of its descending parallel channel; a breakout from this structure would favor the bulls.