|

NZD/JPY Price Analysis: Pair saw gains but remains stuck in trading channel

  • NZD/JPY rose by 0.58% to 91.65 during Monday's session.
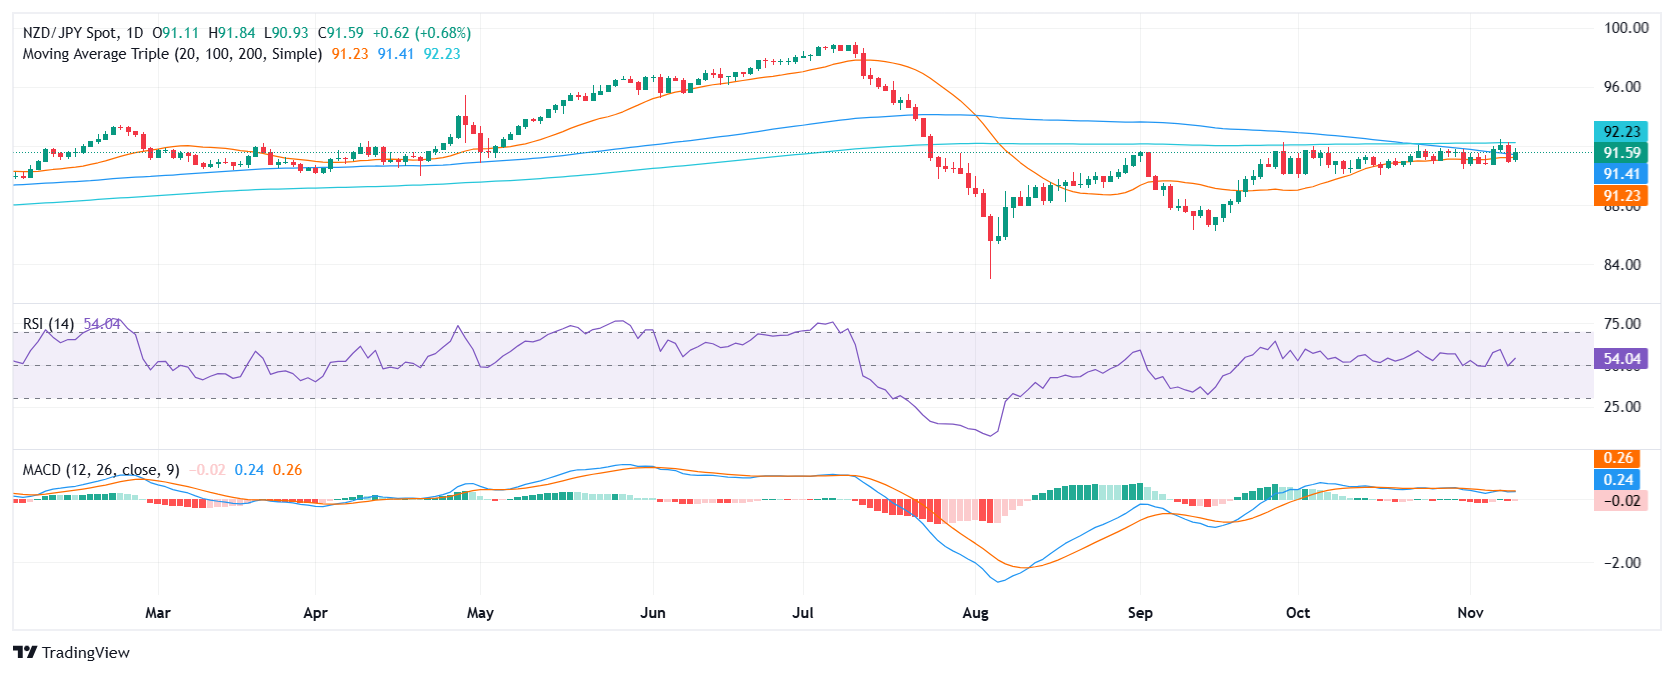
  • NZD/JPY gained ground, but the cross remains stuck within a clear trading range between 92.00 and 91.00.
  • The RSI indicates that buying pressure has been building, while the MACD suggests that selling pressure has been flat.

The NZD/JPY pair rose by 0.58% to 91.65, continuing the positive momentum seen during Monday's session. However, the pair remains stuck within a clear trading channel between 92.00 and 91.00. The overall momentum seems to be mixed, as the pair has been unable to break out of its trading range. A bearish crossover completed between the 20 and 100-day Simple Moving Averages (SMA) might push the pair lower, according to recent technical analysis.

The technical indicators provide mixed signals for NZD/JPY. The Relative Strength Index (RSI) is currently at 55, which suggests that buying pressure is rising. However, the Moving Average Convergence Divergence (MACD) is currently flat, which suggests that selling pressure is flat. The overall outlook is mixed, as the trend is unable to break out of its trading range.

Despite positive momentum, the pair has not broken out of its trading range. Traders should monitor the pair's reaction at its current trading channel to gauge potential breakout or reversal signals.

NZD/JPY daily chart

Author

Patricio Martín

Patricio is an economist from Argentina passionate about global finance and understanding the daily movements of the markets.

More from Patricio Martín
Share:

Editor's Picks

EUR/USD edges lower below 1.1650 as Middle East tensions fuel US Dollar strength

The EUR/USD pair trades in negative territory around 1.1635 during the early Asian session on Thursday. The US Dollar strengthens against the Euro as escalating Middle East conflict boosts safe-haven flows. Traders brace for the Eurozone Retail Sales and US weekly Initial Jobless Claims reports, which will be released later on Thursday. 

GBP/USD tests key moving averages as growth downgrade weighs

GBP/USD was nearly flat on Wednesday, edging up 0.08% to settle around 1.3370 in a quiet session. The pair has fallen sharply from its late-January high near 1.3870 and is now testing the 200-day Exponential Moving Average, with this week's one-week forex heatmap showing Pound Sterling as one of the worst performers against the US Dollar, down about 1.4% on the week.

Gold buyers stay hopeful amid Middle East war, China growth woes

Gold is building on the previous rebound in Thursday’s Asian trades, testing offers once again at the $5,200 threshold. Deeper escalation of the Middle East war and dovish US Federal Reserve monetary policy outlook continue to support Gold.

Trump presses Congress on CLARITY bill after meeting with Coinbase CEO

US President Donald Trump is urging legislators to pass the CLARITY Act after allegedly meeting with Coinbase CEO Brian Armstrong amid growing dispute over stablecoin yields.

First Venezuela, now Iran: The US-China energy war escalates

At first glance, the latest escalation involving the United States with both Iran and Venezuela looks like another chapter in a long-running geopolitical story. But viewed through a broader strategic lens, something else may be unfolding: Energy.

Bittensor extends recovery despite retail demand slump

Bittensor, a leading Artificial Intelligence token, is aging up above $190 at the time of writing on Wednesday. Steady price increases characterise the broader crypto market, with Bitcoin holding above $71,000 and Ethereum above $2,000.