NZD/JPY Price Analysis: On the bear's watchlist as price holds below 4-HR resistance
- NZD/JPY bears looking into prospects below the support structure.
- The monthly chart also offers upside potential still as well as downside from current resistance.

NZD/JPY is dipping in and out of bearish 4-hour technical readings and testing both a critical resistance and support level of the consolidation channel in doing so.
The following is a bearish assessment which offers the prospects of a short on the break of the support structure.
In a top-down analysis, we can see that there is too much risk of a continuation of the broader bullish trend to anything with the pair until a bearish environment has been confirmed.
Monthly chart
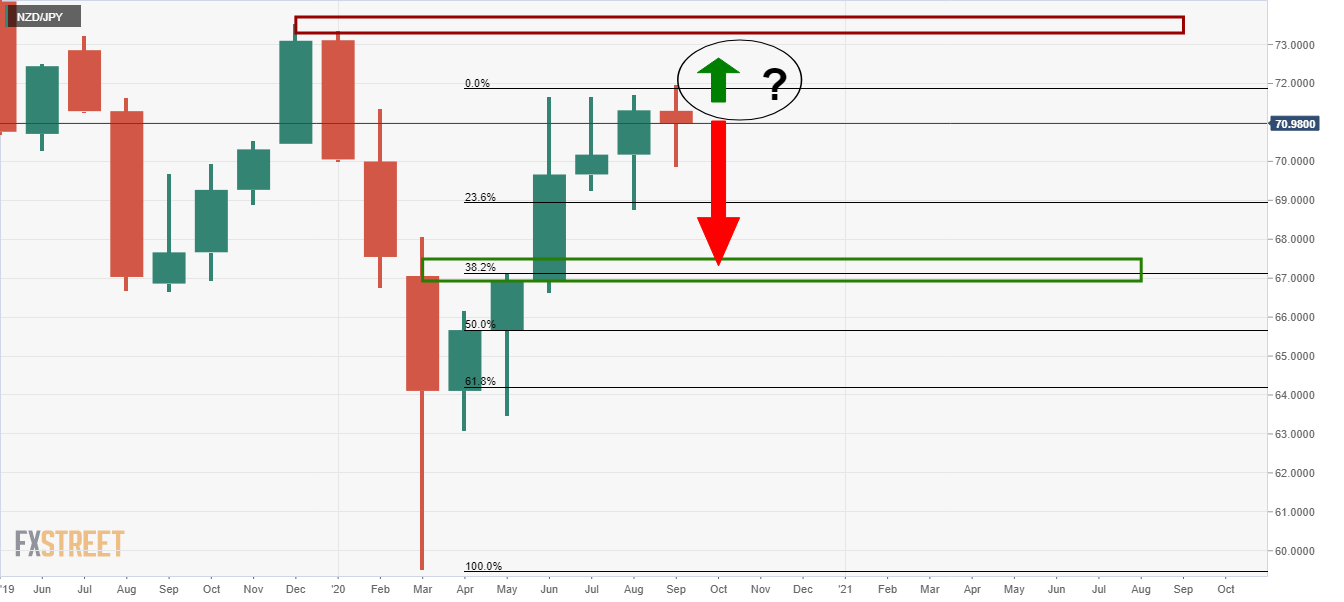
There could still be some more upside to go yet, so the prudent thing to do is monitor for price action signals and a confirmation of a bearish environment on the short term charts.
Weekly chart
-637356404529268645.png)
The weekly outlook could develop a similar price action pattern as illustrated above towards bearish targets 1 and 2.
Daily chart
-637356404908825118.png)
There is a 1,2,3 set up and it would appear that the current resistance is holding up, creating the prospects for wave 3 to the downside.
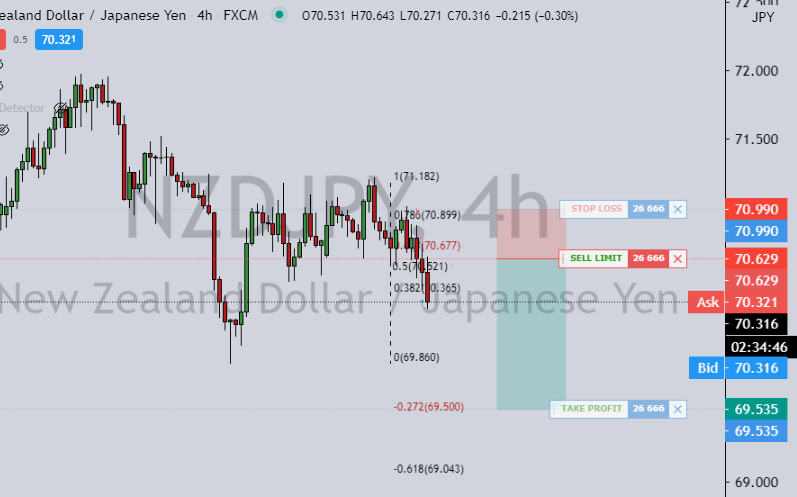
4HR chart
-637356412231652335.png)
While the price holds above the support structure, there is not a strong enough bias to sell the pair until the structure is broken.
However, a short taken at market protected by a stop loss placed above structure is offering a 2.5 risk to reward.
Although, the same could be achieved with more conviction once the price is below the 21 moving average and on a break and restest of the support structure turning into new resistance.
Update: Sell limit in
Update: Target moved to breakeven
There has been a sharp move to the downside breaking structure which invalidates the trade.
-637359781592313331.png)
Author

Ross J Burland
FXStreet
Ross J Burland, born in England, UK, is a sportsman at heart. He played Rugby and Judo for his county, Kent and the South East of England Rugby team.


