|

NZD/JPY Price Analysis: Cross dips towards 20-day SMA, sellers strengthen

  • Kiwi's grip loosens against the Yen on Friday, moving towards the 20-day SMA.
  • The cross cruises through a consolidation phase while the stance of the bear is strengthening.
  • Defense around the 20-day SMA starts showing signs of weakness, hinting at potential declines.

On Friday, the NZD/JPY pair faced selling pressure, with the cross declining towards the 20-day Simple Moving Average (SMA) at 95.70. It appears that the consolidation phase might have tightened its grip around the pair, restricting the buyers' ability to keep the cross afloat.

The Relative Strength Index (RSI) for NZD/JPY on the daily chart currently stands at 53, reflecting a decrease from the previous session's RSI value of 62. The RSI's movement towards the neutral zone, away from the oversold or overbought regions, hints at a moderation in buying pressure. Meanwhile, the Moving Average Convergence Divergence (MACD) has started to print rising red bars, indicating a growing selling momentum and reinforcing the possibility of extended consolidation or even possible declines.

NZD/JPY daily chart

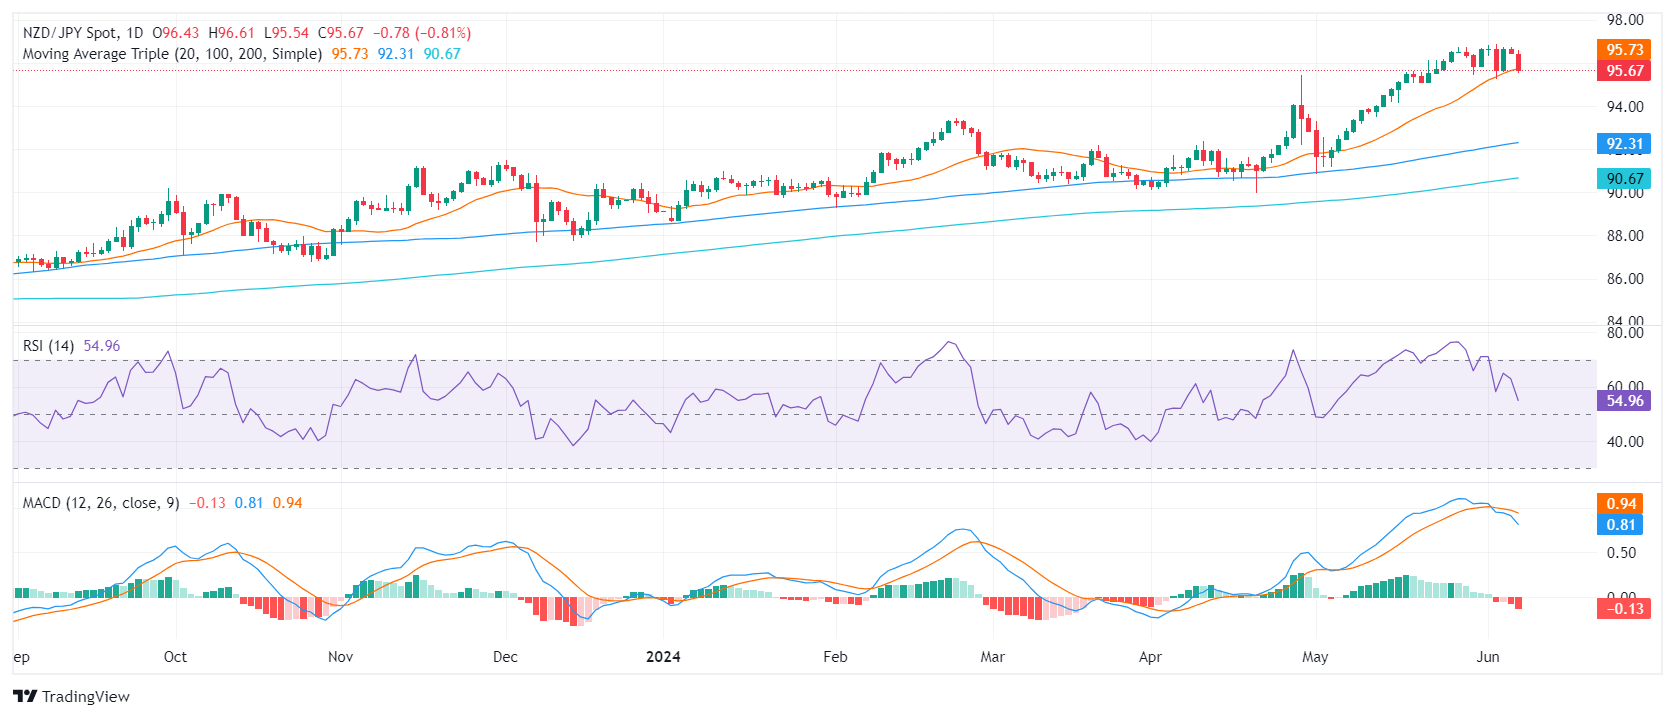
The cross's decline towards 20-day SMA coupled with strengthening selling pressure could potentially disrupt buyers' defense of the mentioned support. Despite the recent jump from around 91.00 to 96.00 since early May, it seems that consolidation has started to reign, marking a pause in the uptrend as gains are consolidated.

NZD/JPY

Overview
Today last price95.67
Today Daily Change-0.78
Today Daily Change %-0.81
Today daily open96.45
 
Trends
Daily SMA2095.63
Daily SMA5093.35
Daily SMA10092.25
Daily SMA20090.62
 
Levels
Previous Daily High96.74
Previous Daily Low96.4
Previous Weekly High96.74
Previous Weekly Low95.43
Previous Monthly High96.74
Previous Monthly Low90.83
Daily Fibonacci 38.2%96.53
Daily Fibonacci 61.8%96.61
Daily Pivot Point S196.32
Daily Pivot Point S296.19
Daily Pivot Point S395.98
Daily Pivot Point R196.66
Daily Pivot Point R296.87
Daily Pivot Point R397

Author

Patricio Martín

Patricio is an economist from Argentina passionate about global finance and understanding the daily movements of the markets.

More from Patricio Martín
Share:

Editor's Picks

EUR/USD holds losses below 1.1650 on renewed USD uptick

EUR/USD is off the low but remains in the red below 1.1650 in European trading on Thursday. The pair faces headwinds from a renewed uptick in the US Dollar amid a negative shift in risk sentiment. Surging energy prices due to the Middle East war keep the bearish pressure intact on the Euro. The US Jobless Claims data are next of note. 

GBP/USD stays weak near 1.3350 amid UK stagflation risks

GBP/USD sticks to losses near 1.3350 in the European session on Thursday. The Pound Sterling loses ground amid fears that the United Kingdom economy could face stagflation risks due to higher energy prices, while the US Dollar attracts fresh havem demand ahead of the US Jobless Claims data. 

Gold climbs near $5,200 as Iran war fuels safe-haven demand

Gold price extends its gains for the second successive session on Thursday as traders seek safety amid the ongoing war in the Middle East. US and Israeli strikes across Iranian territory and widespread Iranian missile and drone retaliation across the Middle East, including attacks on regional targets and military sites, prolong the crisis and its impact.

Top Crypto Gainers: Decred, Zcash, and Dogecoin lead recovery as Bitcoin crosses $72,000

Bitcoin trades above $72,500 at press time on Thursday, holding its 6% gain from the previous day, contributing to a broader market recovery. The total cryptocurrency market capitalization stands at over $2.43 trillion as the broader market sentiment improves significantly.

First Venezuela, now Iran: The US-China energy war escalates

At first glance, the latest escalation involving the United States with both Iran and Venezuela looks like another chapter in a long-running geopolitical story. But viewed through a broader strategic lens, something else may be unfolding: Energy.

Cardano Price Analysis: Approaches key trendline amid bearish sentiment

Cardano (ADA) price is approaching its descending trendline around $0.28 at the time of writing, set to shape the next directional move. The derivatives metrics paint a bearish picture, with ADA’s Open Interest continuing to fall and short bets rising among traders.