|

NZD/JPY Price Analysis: Bullish momentum resumes after sideways consolidation

  • NZD/JPY has risen by 0.75% to 91.70 in Monday's session, signaling a bullish resumption.
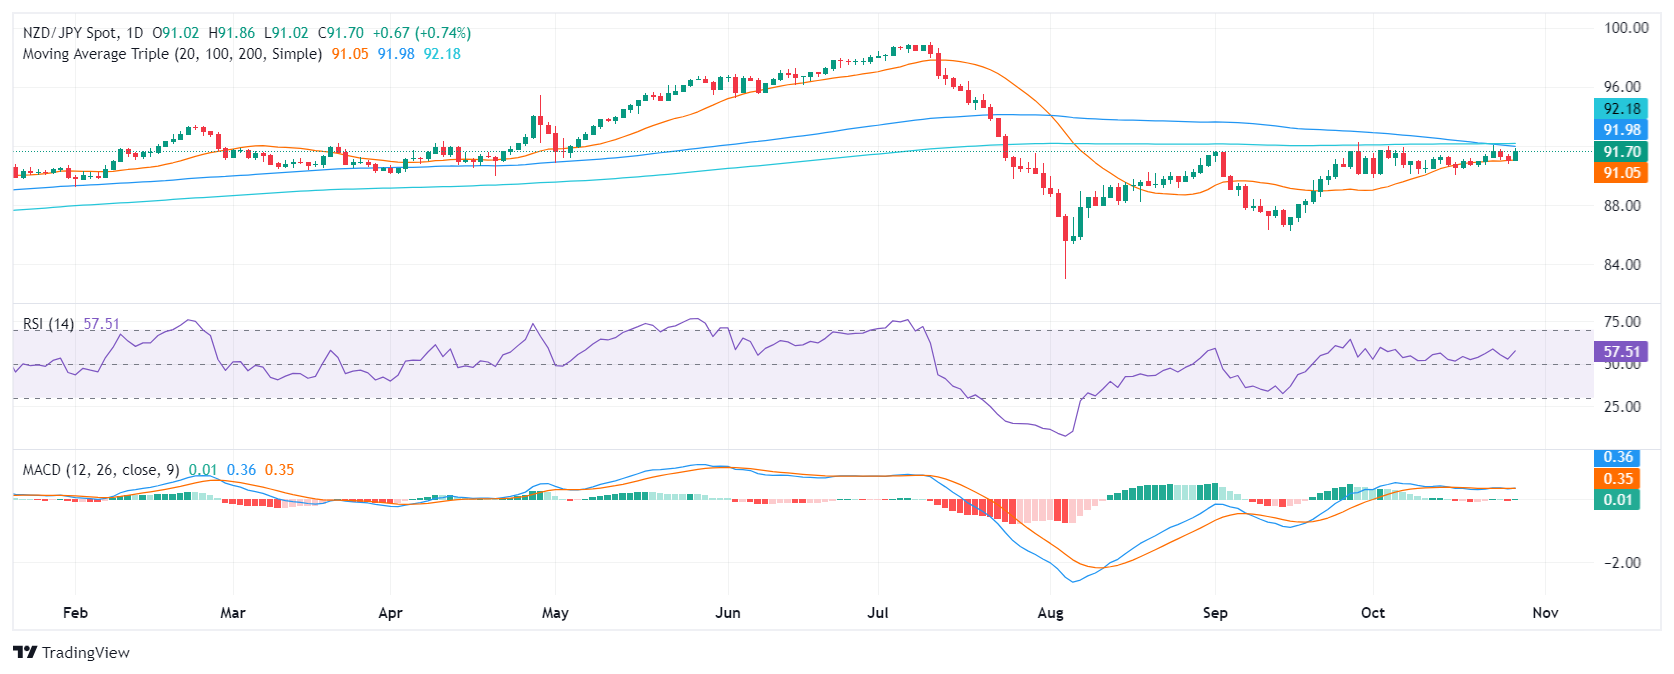
  • Technical indicators show a neutral outlook, with the RSI at 58 and the MACD hovering around the zero line.

NZD/JPY has resumed its upward trajectory after a period of consolidation. In Monday's session, the pair surged to 91.70, suggesting a potential shift in market sentiment. This move could be the beginning of a new bullish phase for NZD/JPY.

While technical indicators currently portray a neutral outlook, they do not contradict the bullish momentum evident in the price action. The Relative Strength Index (RSI) has risen at 58, indicating that buying pressure has stabilized. Meanwhile, the Moving Average Convergence Divergence (MACD) histogram is hovering around the zero line, signaling a lack of clear direction. However, the MACD is beginning to show signs of a bullish crossover, which would align with the positive price action.

The pair has been trading sideways over the past sessions, within a narrow range defined by support at 91.00 and resistance at 92.00. The 20-day Simple Moving Average (SMA), around the mentioned lower boundary will hold as critical support in the event of a pullback as it was defended by the buyers in the last two weeks but if sellers breach it, it might flip the table.

NZD/JPY daily chart

Author

Patricio Martín

Patricio is an economist from Argentina passionate about global finance and understanding the daily movements of the markets.

More from Patricio Martín
Share:

Editor's Picks

EUR/USD appears supported by the 200-day SMA, for now

Following an early pullback to multi-week lows near 1.1670, EUR/USD now manages to reclaim the 1.1700 region as the NA session draws to a close on Monday. The steep retracement in spot follows the equally strong move higher in the US Dollar, as investors continue to assess the geopolitical landscape in the wake of the US and Israel attacks on Iran.


GBP/USD hits new yearly lows near 1.3300

GBP/USD adds to the recent bearish tone, approaching to the key 1.3300 support to reach fresh YTD troughs against the backdrop of the robust performance of the US Dollar. Indeed, Cable’s decline comes amid the firm demand for the safe-haven space in the wake of the US and Israel attacks to Iran.

Gold clings to gains as US-Iran conflict continues to underpin safe-haven assets

Gold retains positive bias for the fifth consecutive day on Tuesday as rising geopolitical tensions in the Middle East continue to underpin safe-haven assets. However, a bullish US Dollar could keep the bullion below its highest level since late January, set on Monday, warranting caution before positioning for any further appreciation.

Strategy lifts holdings to 3.4% of Bitcoin's total supply amid inflows into crypto products

Strategy continued its accumulation of the top crypto last week, acquiring 3,015 BTC for $204 million amid renewed interest in crypto products after four weeks of outflows.

The Fed is finally talking about AI – Here's why it matters for the US Dollar

AI is moving from earnings calls into the heart of monetary policy discussions, forcing Federal Reserve officials to confront a new question: How to act if AI reshapes inflation, employment and interest rates at the same time?

Grass 20% bullish breakout defies broader market weakness

Grass (GRASS) is edging up above $0.30 at the time of writing on Monday. The token’s notable 20% intraday surge stands out amid heightened volatility in the broader crypto market.