|

NZD/JPY Price Analysis: Bullish momentum flat, 20-day SMA proves to be a strong barrier

  • The NZD/JPY continues trading side-ways using the 20-day SMA as a support.
  • RSI and MACD indicate declining buying pressure.
  • Buyers must defend th 20-day SMA to avoid losses.

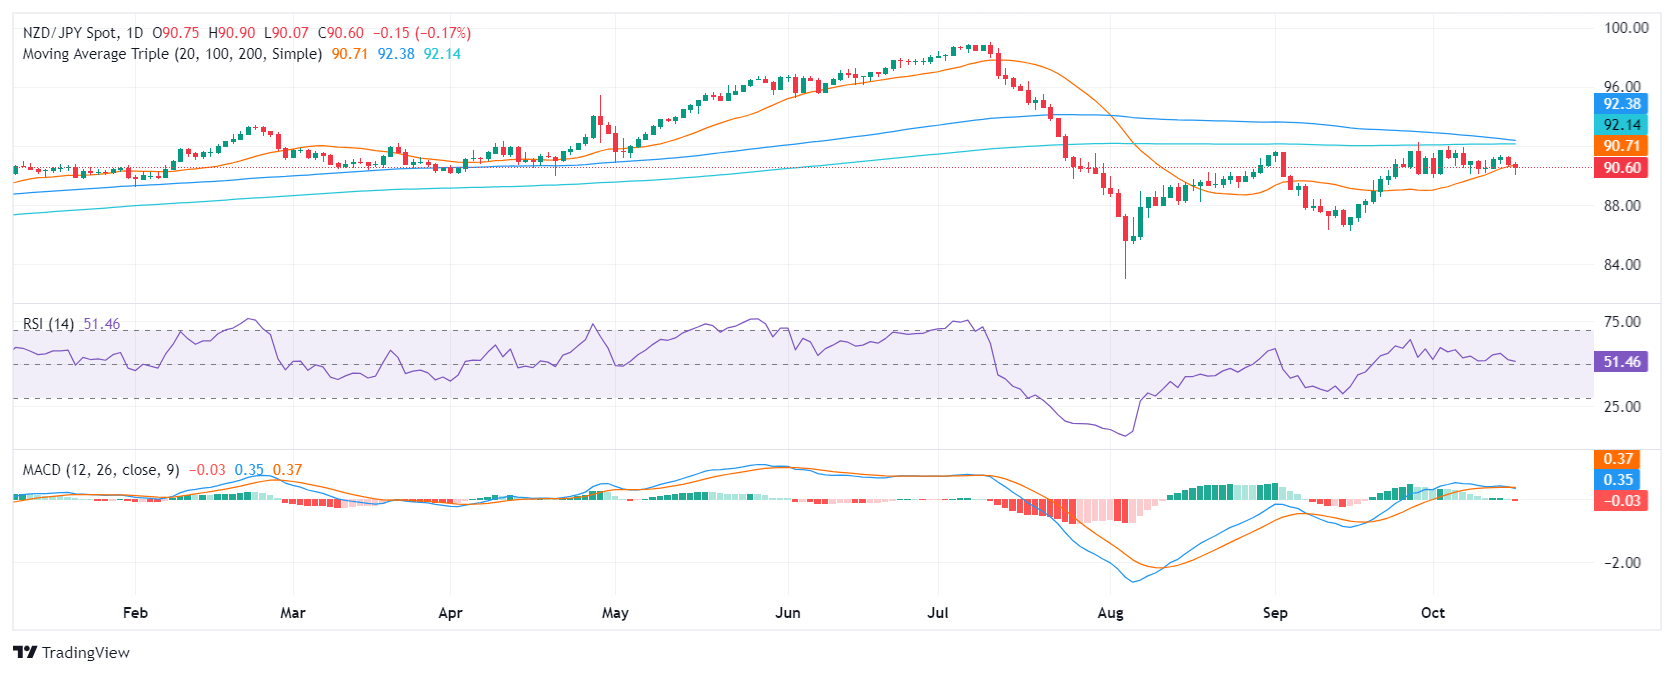
In Wednesday's session, the NZD/JPY mildly fell to 90.60, continuing the sideways movement seen in the past few sessions.

The daily Relative Strength Index (RSI) is currently at 51, indicating that the pair is in the positive area. However, the RSI is declining, suggesting that buying pressure is declining. The Moving Average Convergence Divergence (MACD) histogram is green and decreasing, confirming the bearish momentum.

The 90.60 level remains crucial for the near-term outlook of the NZD/JPY pair. On Wednesday, the pair continued to struggle near this support level. A breakdown below 90.60 could pave the way for further losses, potentially targeting the next psychological support at 89.50. However, if the pair holds above 90.60 and buyers regain strength, a reversal could push the price towards the 91.00 resistance level and even up to 92.00, where the 20, 100, and 200-day Simple Moving Averages (SMA) converge.

Bears have been persistently testing the 20-day SMA, which has served as a notable support. A successful break below this level could solidify the bearish momentum, leading to increased downside pressure.

NZD/JPY Daily chart

Author

Patricio Martín

Patricio is an economist from Argentina passionate about global finance and understanding the daily movements of the markets.

More from Patricio Martín
Share:

Markets move fast. We move first.

Orange Juice Newsletter brings you expert driven insights - not headlines. Every day on your inbox.

By subscribing you agree to our Terms and conditions.

Editor's Picks

EUR/USD recovers to 1.1750 region as 2025 draws to a close

Following the bearish action seen in the European session on Wednesday, EUR/USD regains its traction and recovery to the 1.1750 region. Nevertheless, the pair's volatility remains low as trading conditions thin out on the last day of the year.

GBP/USD stays weak near 1.3450 on modest USD recovery

GBP/USD remains under modest beairsh pressure and fluctuates at around 1.3450 on Wednesday. The US Dollar finds fresh demand due to the end-of-the-year position adjustments, weighing on the pair amid the pre-New Year trading lull. 

Gold retreats to $4,300 area, looks to post monthly gains

Gold stays on the back foot on the last day of 2025 and trades near $4,300, possibly pressured by profit-taking and position adjustments. Nevertheless, XAU/USD remains on track to post gains for December and extend its winning streak into a fifth consecutive month.

Bitcoin, Ethereum and XRP prepare for a potential New Year rebound

Bitcoin, Ethereum, and Ripple are holding steady on Wednesday after recording minor gains on the previous day. Technically, Bitcoin could extend gains within a triangle pattern while Ethereum and Ripple face critical overhead resistance. 

Economic outlook 2026-2027 in advanced countries: Solidity test

After a year marked by global economic resilience and ending on a note of optimism, 2026 looks promising and could be a year of solid economic performance. In our baseline scenario, we expect most of the supportive factors at work in 2025 to continue to play a role in 2026.

Crypto market outlook for 2026

Year 2025 was volatile, as crypto often is.  Among positive catalysts were favourable regulatory changes in the U.S., rise of Digital Asset Treasuries (DAT), adoption of AI and tokenization of Real-World-Assets (RWA).