|premium|

NXT-ID ($NXTD) Close to moving higher

With Bitcoin recently breaking out to new all time highs the Crypto and Blockchain market has reached fever pitch. NXT -ID isn’t your typical crypto stock, but it is in the related field of blockchain.  Lets take a look at what the company does:

“NXT-ID is a manufacturer and distributor of non-monitored and monitored personal emergency response systems.  NXT -ID has extensive experience in access control, biometric and behavior-metric identity verification, security and privacy, encryption and data protection, payments, miniaturization and sensor technologies.

Fit Pay, Inc., a wholly owned subsidiary of NXT-ID, Inc. (NASDAQ: NXTD) and Cascade Financial Technology Corp (Cascade FinTech) are in joint development of a platform that gives cryptocurrency holders the ability to use the value of their currency to make purchases at millions of retail locations worldwide. The new platform will enable devices with stored value exchanged from cryptocurrency to be used for traditional payment transactions.”

Lets dig into the charts!

NXT-ID Elliottwave Daily View

NXTD chart

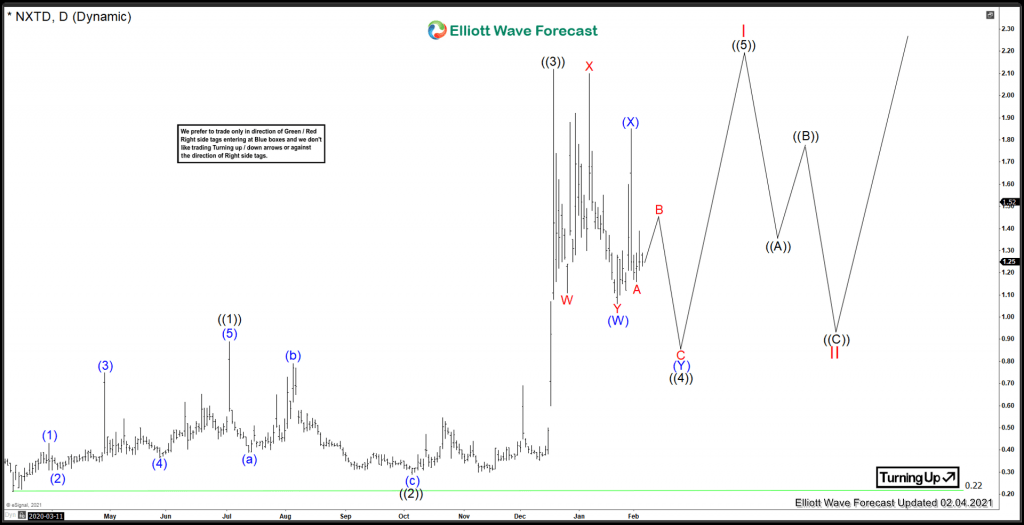
Medium term term view from the all time low in March 2020 set @ 0.22.  NXT -ID went sideways to up for an extended amount of time in a wave ((1)).  After that, corrected for 3 months into ((2)).  From there, a very sharp wave ((3)) took place which peaked at 2.12 on December 17 2020.  After that, it has been sideways to down in a choppy double zig zag corrective pattern.  It is common for instruments to go sideways for extended time after sharp wave 3 advances.  It is possible that ((4)) has found a low where (W) is set and wave ((5)) has already begun.  Moreover, there is no divergence in momentum in daily RSI. One more high with divergence is favoured to set Red I before correcting in Red II.

In Conclusion, ((4)) may still be in progress, but depending on Bitcoin, further weakness may take place before moving higher.  Regardless we do not like to trade the sideways zones but like to trade extreme areas.

Premium

You have reached your limit of 3 free articles for this month.

Start your subscription and get access to all our original articles.

Subscribe to PremiumSign In

Author

Elliott Wave Forecast Team

Elliott Wave Forecast Team

ElliottWave-Forecast.com

More from Elliott Wave Forecast Team
Share:

Editor's Picks

AUD/USD eyes 0.7150 barrier nine-day EMA

AUD/USD inches higher after registering modest losses in the previous day, trading around 0.7130 during the Asian hours. The technical analysis of the daily chart indicates that the pair is moving sideways within the rectangle pattern, suggesting a consolidation as neither the bulls nor the bears have enough momentum to take control of the market.

USD/JPY trades below 160.00 intervention threshold; bullish bias intact

The USD/JPY pair attracts some sellers during the Asian session amid fears that authorities will step in again to prop up the Japanese Yen. Furthermore, the Israel-Lebanon truce prompts some profit-taking around the US Dollar and exerts downward pressure on the currency pair.

Gold puts its 200-day SMA to the test near $4,420

Gold keeps the bullish stance in place in the latter part of Thursday’s session, although a convincing break above the key $4,500 mark per troy ounce still remains elusive. The precious metal’s advance comes amid the resurgence of some selling interest around the Greenback, improving risk sentiment, and declining US Treasury yields across the board.

Bitcoin’s massive storm is back: Why the sell-off is far from over

Bitcoin price action over the last few weeks has felt less like a normal, healthy correction and more like a slow grinding crash that continues to wreak havoc on holdings and trading accounts. And everything suggests that the dramatic crash isn’t over.

Nonfarm payrolls: Testing the limits of Fed policy patience

The upcoming nonfarm payrolls report for May will provide the final update on the US labor market before Kevin Warsh attends his first policy meeting as the new Fed Chair later this month.

Recession on paper: What really moves the Canadian Loonie now?

Statistics Canada handed the headline writers a gift and the analysts a headache. Real GDP shrank 0.1% on an annualized basis in the first quarter, and with the fourth quarter of 2025 revised down to a 1.0% contraction, that is two negative quarters in a row, the textbook definition of a technical recession and Canada's first since the pandemic.