NVIDIA Corp. ($NVDA) found buyers after a corrective pull back
Hello everyone. In today’s article, we will look at the past performance of the 4 Hour Elliott Wave chart of NVIDIA Corp. ($NVDA) The rally from 10.13.2022 low unfolded as a 5 wave impulse breaking to new all time highs with an incomplete bullish sequence from 2.28.2023 low. So, we expected the pullback to unfold in 7 swings and find buyers. We will explain the structure & forecast below:
$NVDA 4h Elliott Wave chart 8.09.2023
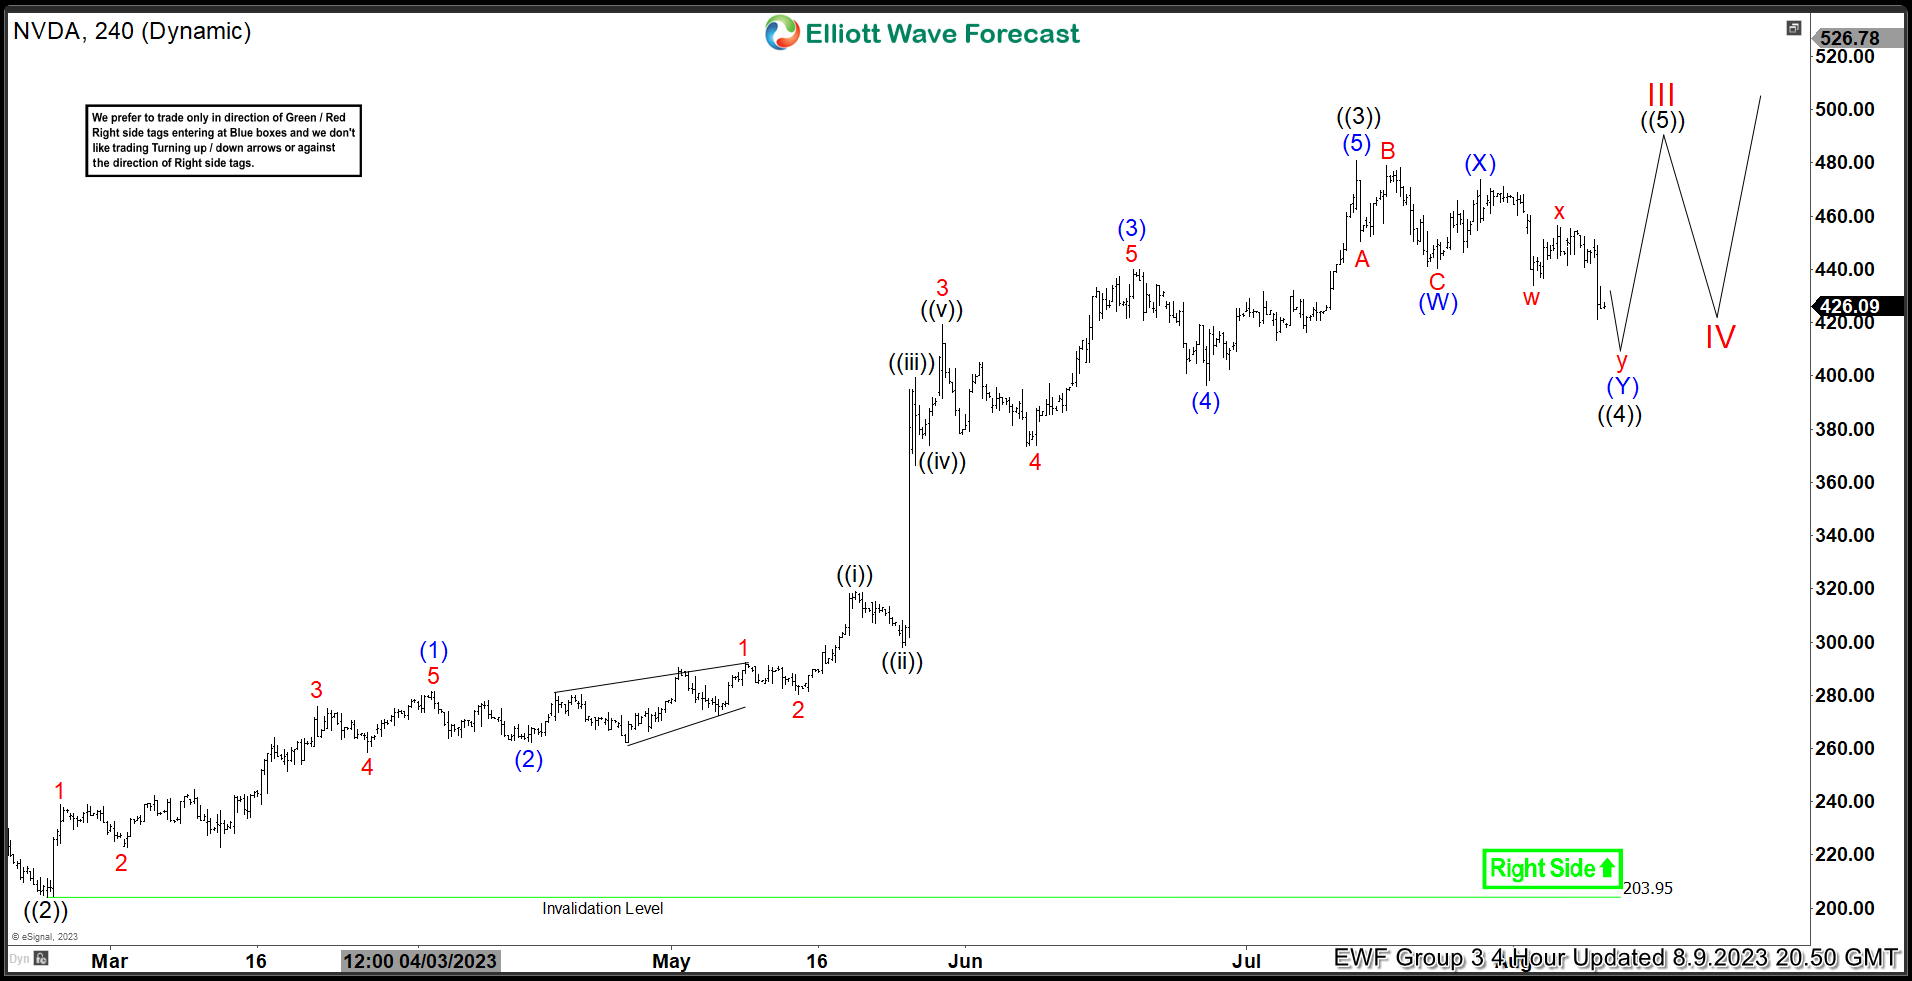
Here is the 4H Elliott Wave count from 8.09.2023. The rally from 2.28.2023 at black ((2)) unfolded in a 5 wave impulse which signaled a bullish trend. We expected the pullback to find buyers in 7 swings against $203.95 low.
$NVDA latest 4h Elliott Wave chart 8.14.2023
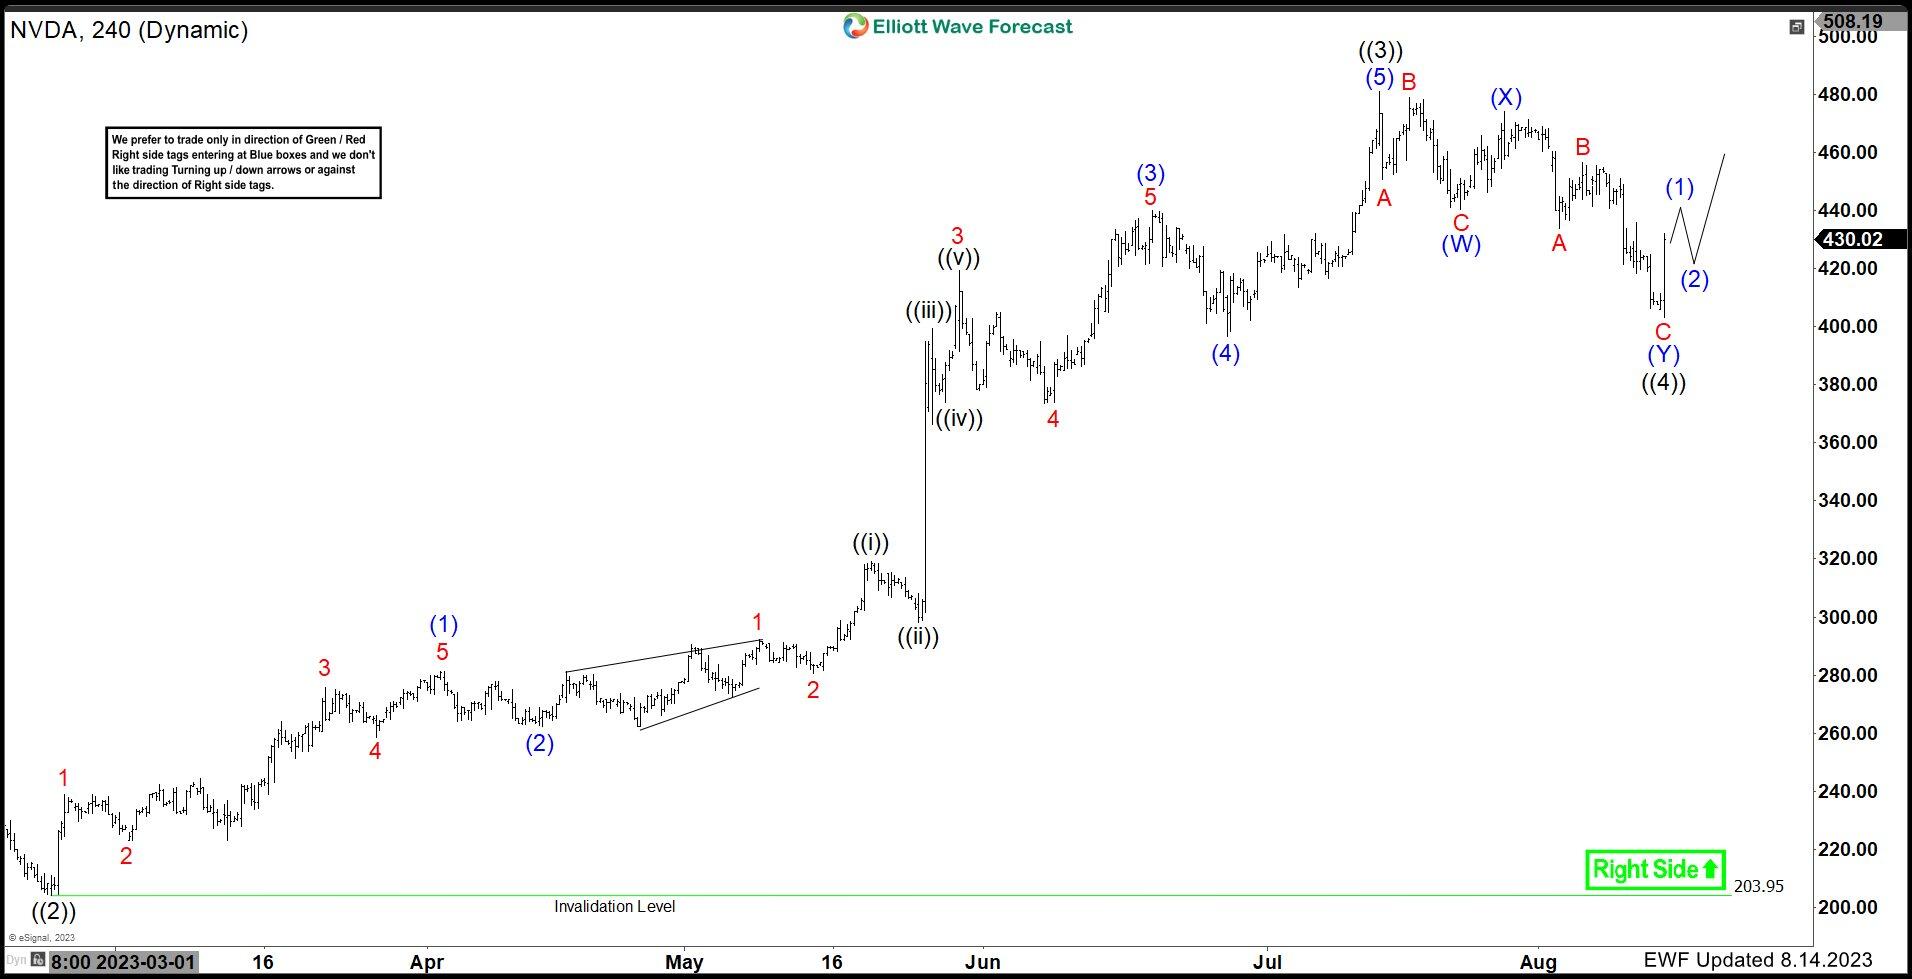
Here is the latest 4H update from 8.14.2023 showing the bounce taking place as expected. The stock has reacted higher after doing 7 swings lower allowing longs to get a risk free position. The bounce can continue higher towards $500 and print a new high for the year OR can fail and become 11 swings lower where we will like to buy it again should that happen.
Premium
You have reached your limit of 3 free articles for this month.
Start your subscription and get access to all our original articles.
Author

Elliott Wave Forecast Team
ElliottWave-Forecast.com


