|

Nikkei 225 Index: Stiff resistance forms around 23,600

  • Nikkei 225 Index fell for second straight day on Tuesday. 
  • US-China trade conflict continues to weigh on global equity indexes.

After closing the first day of the week with a loss of 0.3%, the Nikkei 225 Index pushed lower on Tuesday as caution over the December 15 deadline for the US' tariff hike on Chinese imports continues to weigh on sentiment. During an interview with Fox Business on Tuesday, US Commerce Secretary Wilbur Ross noted that having a good deal for the US was more important than the tariff hike.

Reflecting the dismal mood, major European equity indexes are losing more than 1% and the S&P 500 futures are down 0.3% to suggest that Wall Street is likely to start the day in the negative territory.
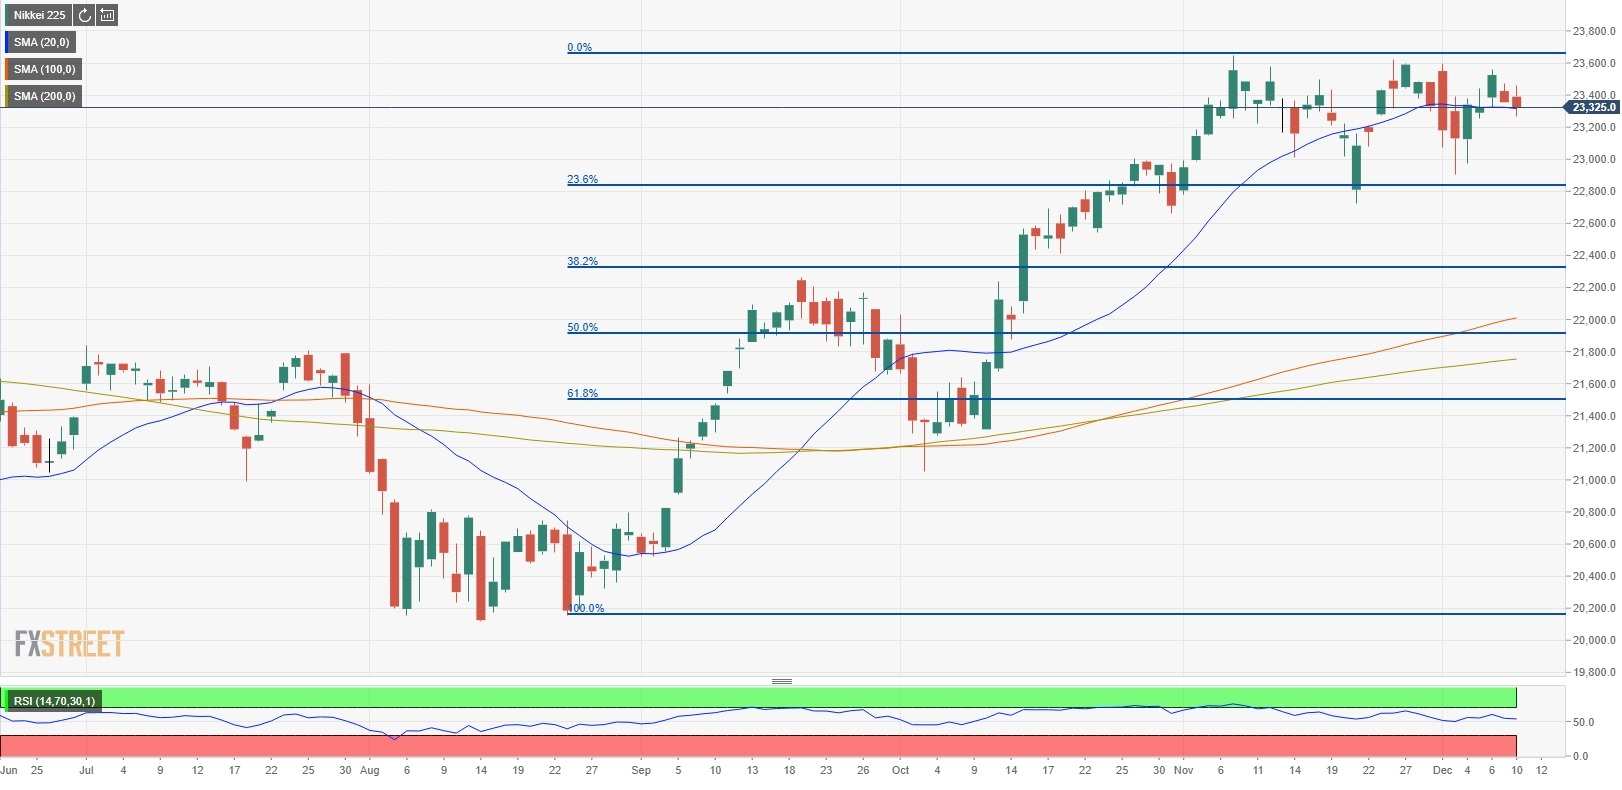
Nikkei 225 Chart

Looking at the daily chart, the index seems to be making lower highs below the 23,600-23,650 area, where the 2019-top that was defined back in early November is located. On the same chart, the RSI indicator continues to move sideways a little above the 50 mark, pointing out to a neutral near-term outlook.

The initial support for the index could be seen at 23,300 (20-day MA) ahead of 23,000 (psychological level) and 22,800 (Fibonacci 23.6% retracement of September-November rally). On the upside, 23,600-23,650 is a significant hurdle before the index could target 24,000 (Sep. 25, 2018, high) and 24,480 (all-time high).

Author

Eren Sengezer

As an economist at heart, Eren Sengezer specializes in the assessment of the short-term and long-term impacts of macroeconomic data, central bank policies and political developments on financial assets.

More from Eren Sengezer
Share:

Markets move fast. We move first.

Orange Juice Newsletter brings you expert driven insights - not headlines. Every day on your inbox.

By subscribing you agree to our Terms and conditions.

Editor's Picks

EUR/USD ticks lower following the release of FOMC Minutes

The US Dollar found some near-term demand following the release of the FOMC meeting minutes, with the EUR/USD pair currently piercing the 1.1750 threshold. The document showed officials are still willing to trim interest rates. Meanwhile, thinned holiday trading keeps major pairs confined to familiar levels.

GBP/USD remains sub- 1.3500, remains in the red

The GBP/USD lost traction early in the American session, maintaining the sour tone and trading around 1.3460 following the release of the FOMC meeting minutes. Trading conditions remain thin ahead of the New Year holiday, limiting the pair's volatility.

Gold stable above $4,350 as the year comes to an end

Gold price got to recover some modest ground on Tuesday, holding on to intraday gains and changing hands at $4,360 a troy ounce in the American afternoon. The bright metal showed no reaction to the release of the FOMC December meeting minutes.

Ethereum: ETH holds above $2,900 despite rising selling activity

Ethereum (ETH) held the $2,900 level despite seeing increased selling pressure over the past week. The Exchange Netflow metric showed deposits outweighed withdrawals by about 400K ETH. The high value suggests rising selling activity amid the holiday season.

Economic outlook 2026-2027 in advanced countries: Solidity test

After a year marked by global economic resilience and ending on a note of optimism, 2026 looks promising and could be a year of solid economic performance. In our baseline scenario, we expect most of the supportive factors at work in 2025 to continue to play a role in 2026.

Crypto market outlook for 2026

Year 2025 was volatile, as crypto often is.  Among positive catalysts were favourable regulatory changes in the U.S., rise of Digital Asset Treasuries (DAT), adoption of AI and tokenization of Real-World-Assets (RWA).