Newmont Corporation – NEM analysis and Elliott Eave technical forecast [Video]
![Newmont Corporation – NEM analysis and Elliott Eave technical forecast [Video]](https://editorial.fxsstatic.com/images/i/Economic-Indicator_Recession-5_XtraLarge.png)
NEM Elliott Wave technical analysis
Today's Elliott Wave update focuses on the Australian Stock Exchange (ASX) listing for NEWMONT CORPORATION – NEM. We identify a bullish trend, with ASX:NEM currently progressing through Wave 3. This report highlights the potential targets and invalidation points to clarify where the bullish momentum remains intact and where the trend may end.
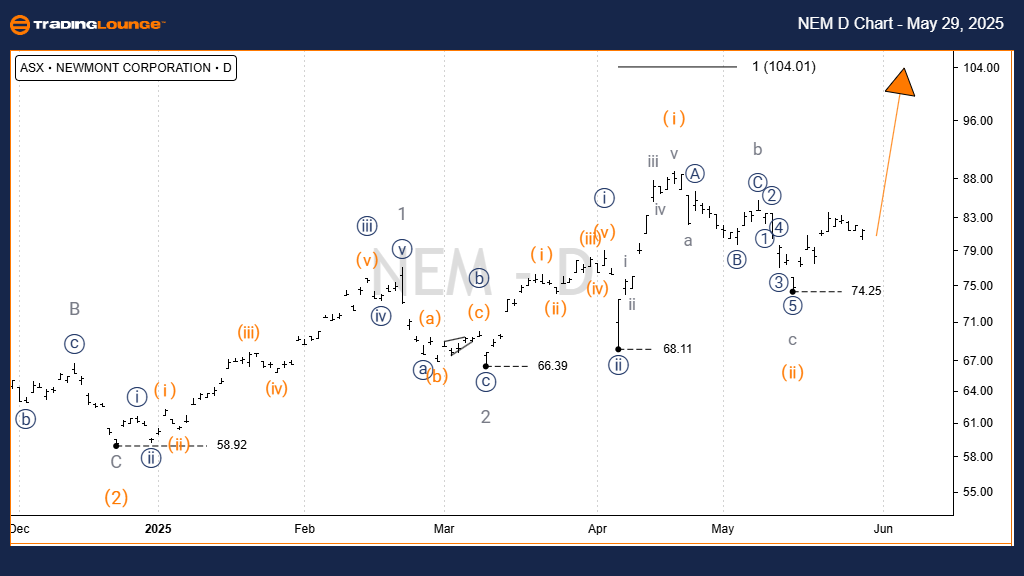
One-day chart analysis (semilog scale)
-
Function: Primary trend (Minor degree, grey).
-
Mode: Motive.
-
Structure: Impulse.
-
Position: Wave iii) orange within Wave iii) navy of Wave 3 grey.
-
Details:
Wave ii) orange likely completed at the 74.25 low as a zigzag correction (a-b-c in grey). Since then, Wave iii) orange has been moving upward with a projected target near 100.00. -
Invalidation point: 74.25.
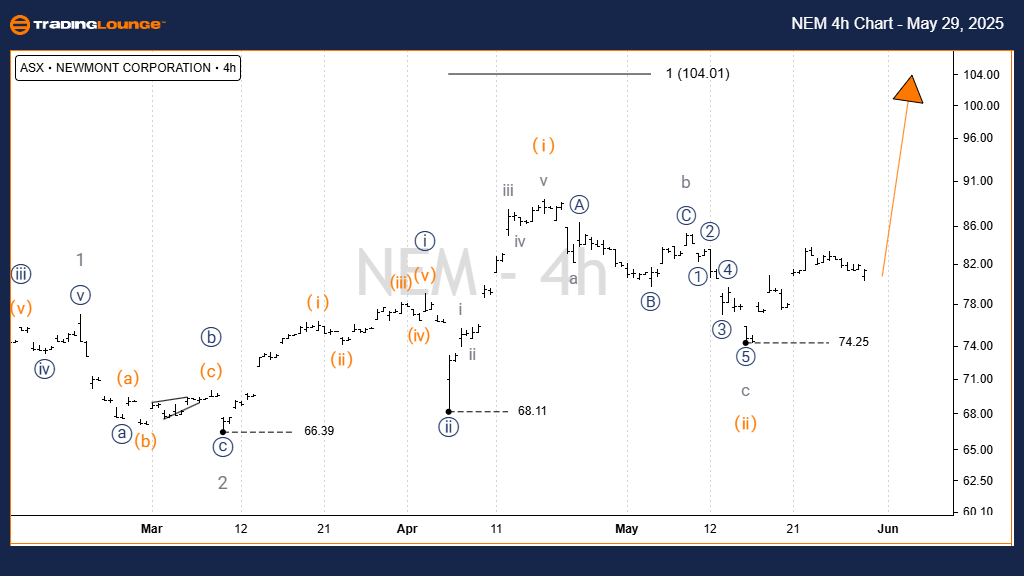
Elliott Wave technical analysis four-hour chart
-
Function: Primary trend (Minor degree, grey).
-
Mode: Motive.
-
Structure: Impulse.
-
Position: Wave iii) orange within Wave ((iii)) navy of Wave 3 grey.
-
Details:
The 4-hour chart confirms the ongoing upward move of Wave iii) orange. The medium-term target remains 100.00, with a short-term target near 90.00 for Wave iii grey. -
Invalidation point: 74.25.
Conclusion
Our analysis presents a well-structured forecast for ASX:NEM, providing readers with crucial insights into trend continuation and momentum confirmation. The targets and invalidation levels offer precise trading cues, aiming to improve forecast reliability. Our method delivers a clear, professional outlook for navigating the current market structure.
Newmont Corporation – NEM analysis and Elliott Wave technical forecast [Video]
Author

Peter Mathers
TradingLounge
Peter Mathers started actively trading in 1982. He began his career at Hoei and Shoin, a Japanese futures trading company.


