Netflix stock (NFLX) buying the dips at the blue box area [Video]
![Netflix stock (NFLX) buying the dips at the blue box area [Video]](https://editorial.fxstreet.com/images/Markets/Equities/Industries/Media/Netflix.jpg)
Hello fellow traders. In this technical article we’re going to take a look at the Elliott Wave charts charts of Netflix (NFLX) Stock published in members area of the website. Our members are aware of the numerous positive trading setups we’ve had recently. One of them is NFLX, which made a pullback that concluded right at the Equal Legs zone (Blue Box Area). In the following text, we’ll delve into the Elliott Wave pattern and trading setup.
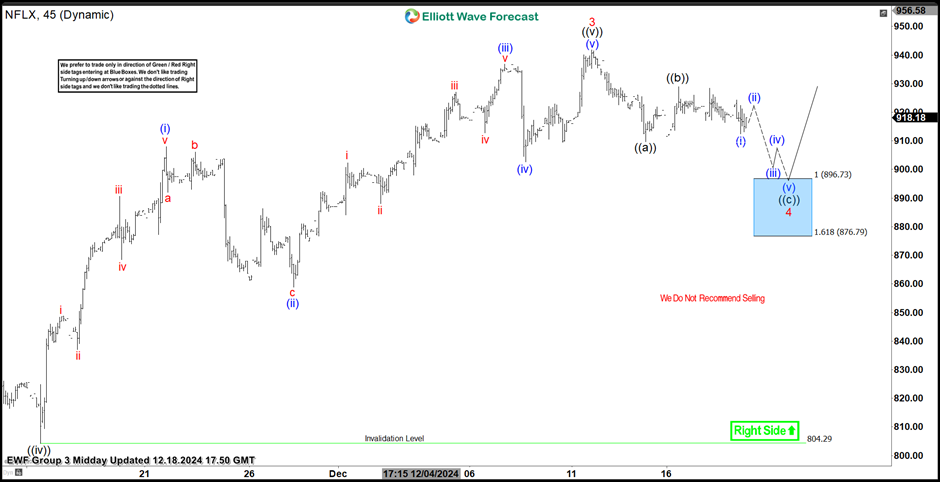
NFLX H1 update 12.18.2024
Netflix stock is currently in a wave 4red pullback, unfolding as 3 waves ((a))((b))((c)) pattern. The stock should ideally see an extension down toward the blue box-buying zone: the 896.73-876.79 area. We expect the stock to rally toward new highs or bounce in 3 waves from there. When the price retraces to the 50% Fibonacci level against the ((b) )blue connector, we’ll secure positions, set the stop loss at breakeven, and take partial profits.
Quick reminder on how to trade our charts :
Red bearish stamp+ blue box = Selling Setup
Green bullish stamp+ blue box = Buying Setup
Charts with Black stamps are not tradable.
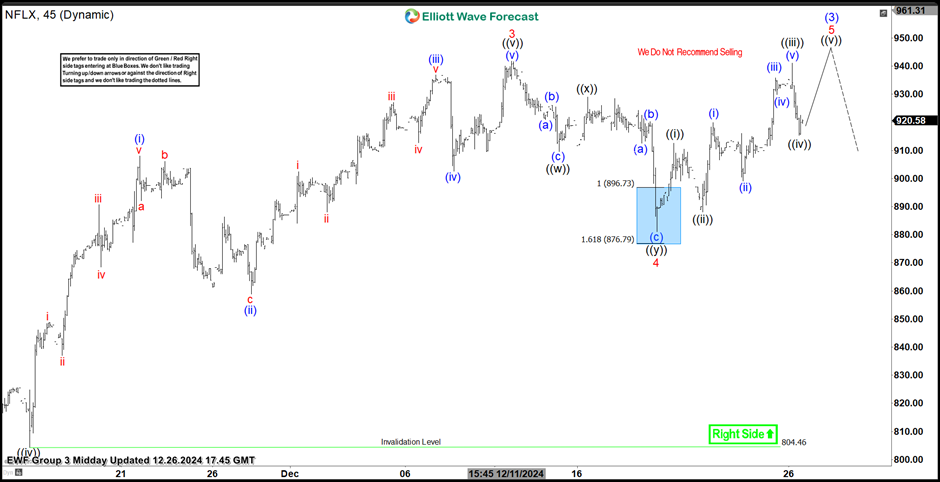
NFLX H1 update 12.26.2024
The stock made drop down toward our blue box area. Netflix found buyers as expected and made a good rally from our buying zone . Consequently, any long positions taken from the equal legs area are now risk-free, and we have already taken partial profits. We consider wave 4 red completed at the 887.14 low The stock remains bullish against the 804.46 pivot. As long as that pivot holds in our system, we believe the stock should continue finding buyers in 3, 7, 11 swings, for a further extension toward new highs ideally.
Keep in mind not every chart is trading recommendation.
Author

Elliott Wave Forecast Team
ElliottWave-Forecast.com


