Netflix (NFLX) Stock Price and Forecast: Netflix stock falling after results disappoint investors
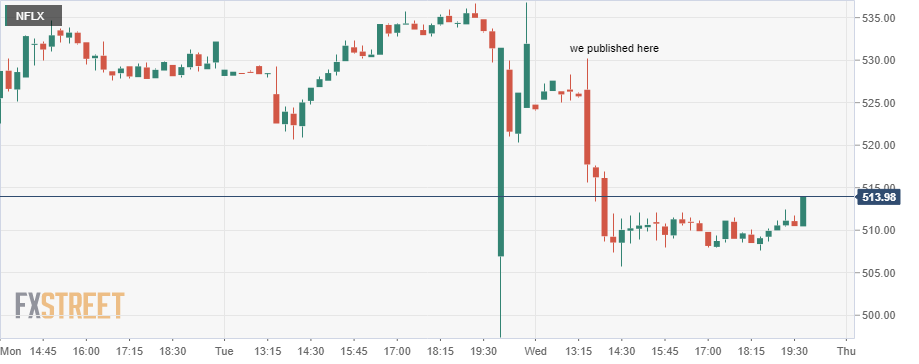
- Netflix (NFLX) fell perfectly from our entry price identified on Wednesday.
- NFLX results were mixed, but the stock recovered strongly.
- Netflix retraced but did not make new post-earnings high.

Update: A nice call here at FXStreet on Wednesday. To recap: "The retracement to $530 can be used as an opportunity to go short with a stop above the 9 and 21-day moving averages at $535. Within two hours of us publishing this call, NFLX stock was trading at $505, a nice 3% gain in the space of two hours. The zone around $500 has a lot of volume that provides good support. It is not until we get through $480 that things could speed up again.
Netflix announced results after the market closed on Tuesday, and they appear to be a mixed bag. Netflix was a huge beneficiary in the early stages of the pandemic as there was not a whole lot else to do but sit at home and stream content. Subscriber numbers jumped accordingly and so too did the stock price. Therefore, it was inevitable that such growth would slow once economies started to reopen, and that is exactly what has happened.
Netflix Q2 earnings
Netflix Earnings Per Share (EPS) was slightly behind analyst forecasts, coming in at $2.97 versus $3.15 forecast, but revenue was ahead coming in at $7.34 billion marginally beating the $7.32 billion estimate. Netflix said it finished Q2 2021 with 290 million paid subscriptions and added 1.5 million subscriptions or memberships in Q2 ahead of its own forecast for 1 million.
The company also issued Q3 guidance which was ahead of previous analyst forecasts. NFLX said Q3 EPS is estimated to be $2.55 versus $2.17 forecast, sales are forecast to be $7.477 billion just behind the forecast for $7.48 billion.
The subscriber growth was a bit of a mixed bag with US and Canada numbers coming in behind forecasts, losing 430k viewers in this region versus forecasts for a gain of 52k. The biggest growth region was Latin America.
The comparisons were tough as Netflix had scored huge gains during the pandemic which saw the stock and subscriber numbers soar. So, maintaining that and comparing against 2020 numbers was always going to be tough. The big issue that investors are likely focusing on is guidance on subscribers with Netflix saying it aims for 3.5 million new subscribers in Q3 while Wall Street had pencilled in a growth of 5.86 million.
Netflix stock forecast
The results were met with an initial burst of disappointment as the shares dumped below $500 but quickly retraced. This can be taken as a positive as the initial probe lower was rejected and buyers defended the level. However, in my view, there is not a huge amount to be bullish on either. The continued choppiness in the share price being matched by the mixed bag of results.
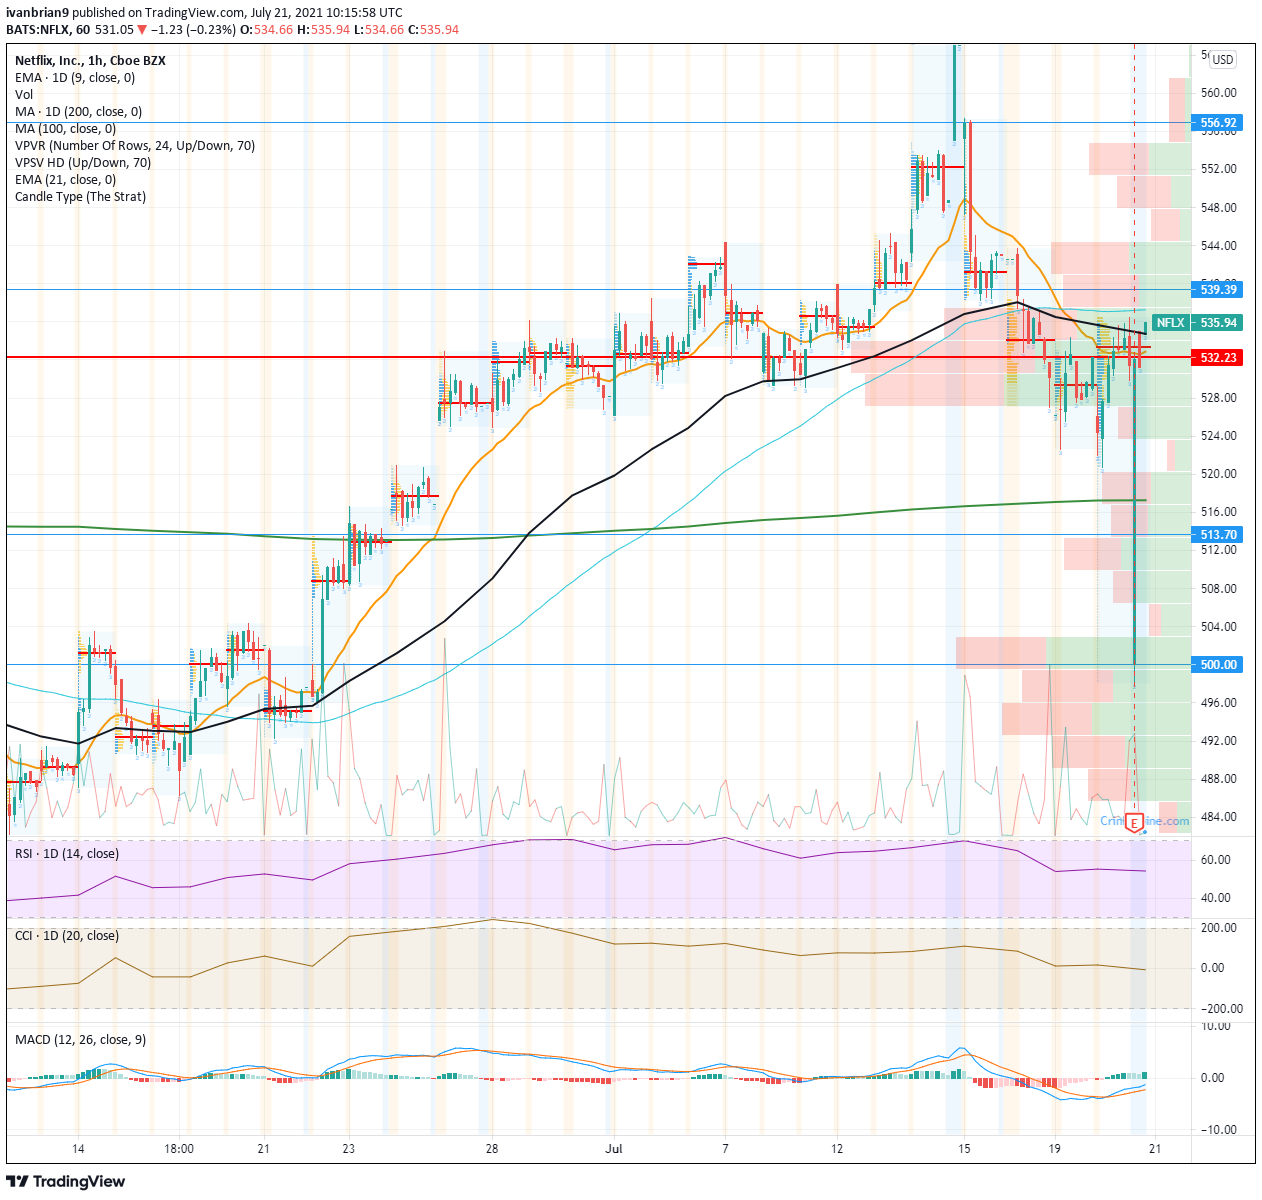
We can see by the hourly chart below just why $500 was held. Not only is it a psychological round number, which the market loves but the volume profile shows a lot of volume here so providing extra support. Volume was light from below $534 enabling the sudden sharp fall but volume picked up and provided support at $500.
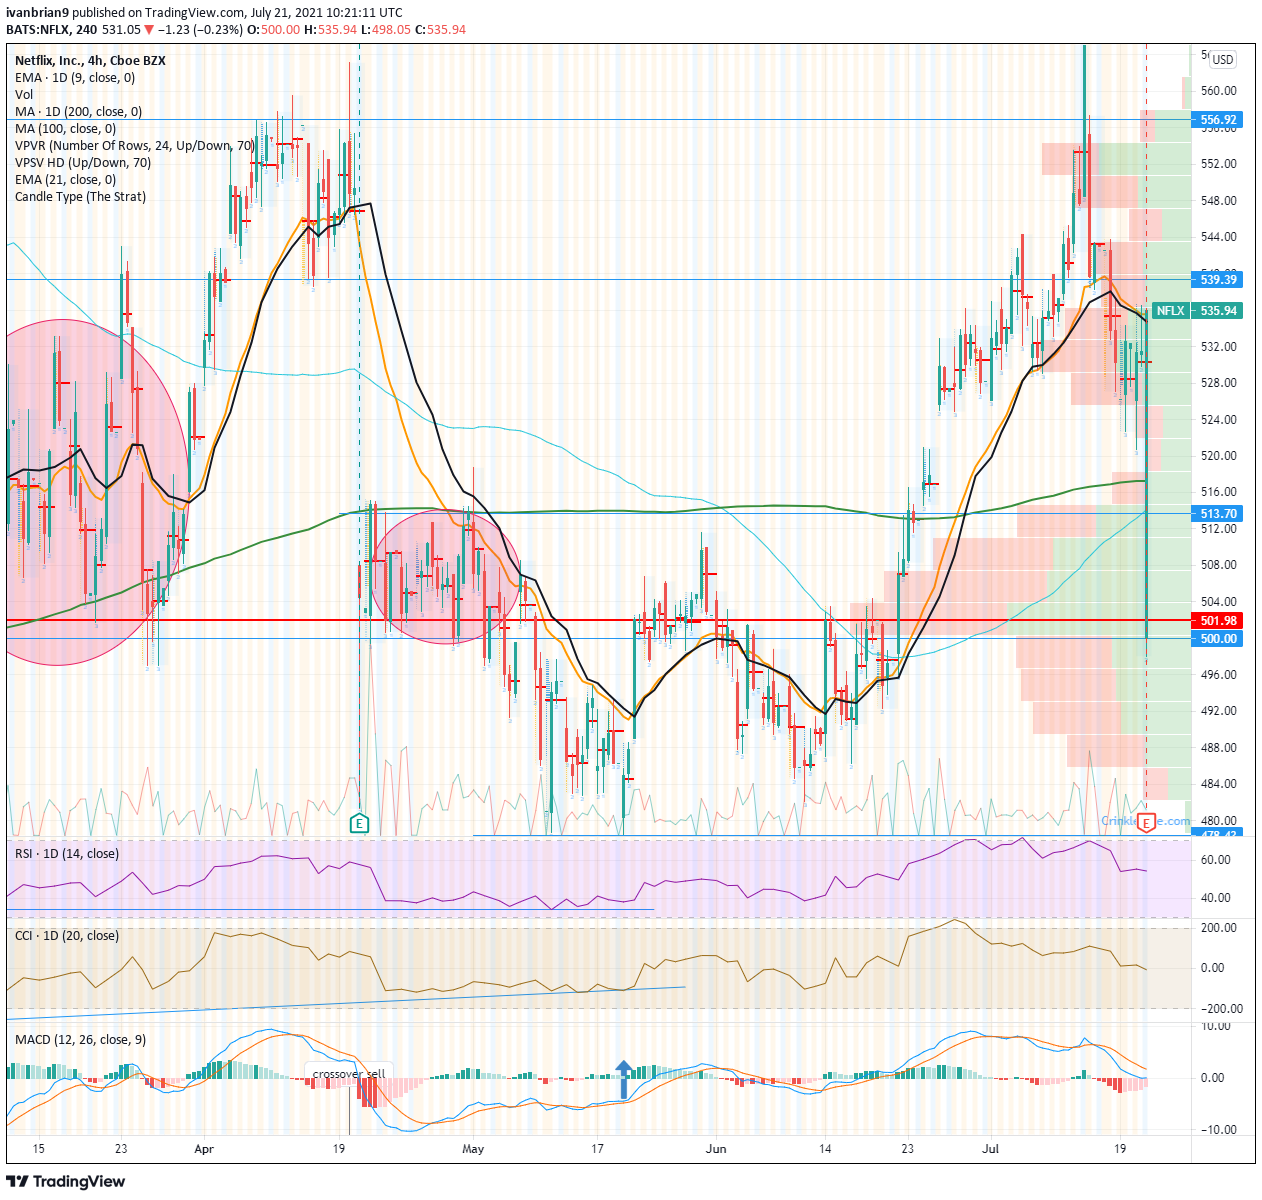
Taking a longer-term view to the 4-hour chart shows the bullish retracement but there is not enough to continue the move and rather this could be an interesting shorting opportunity. The Moving Average Convergence Divergence (MACD) has given a bearish crossover back last week and the market is now nervous after earnings. The retracement to $530 can be used as an opportunity to go short with a stop above the 9 and 21-day moving averages at $535. This is a pretty tight stop but breaking above those levels will end the bearish case as the short-term trend will have turned. The RSI and CCI gave us a bearish divergence not making new highs despite NFLX stock price doing so on July 14.
Like this article? Help us with some feedback by answering this survey:
Author

Ivan Brian
FXStreet
Ivan Brian started his career with AIB Bank in corporate finance and then worked for seven years at Baxter. He started as a macro analyst before becoming Head of Research and then CFO.


