NEM Elliott Wave technical forecast [Video]
![NEM Elliott Wave technical forecast [Video]](https://editorial.fxsstatic.com/images/i/supermicro-01_XtraLarge.jpg)
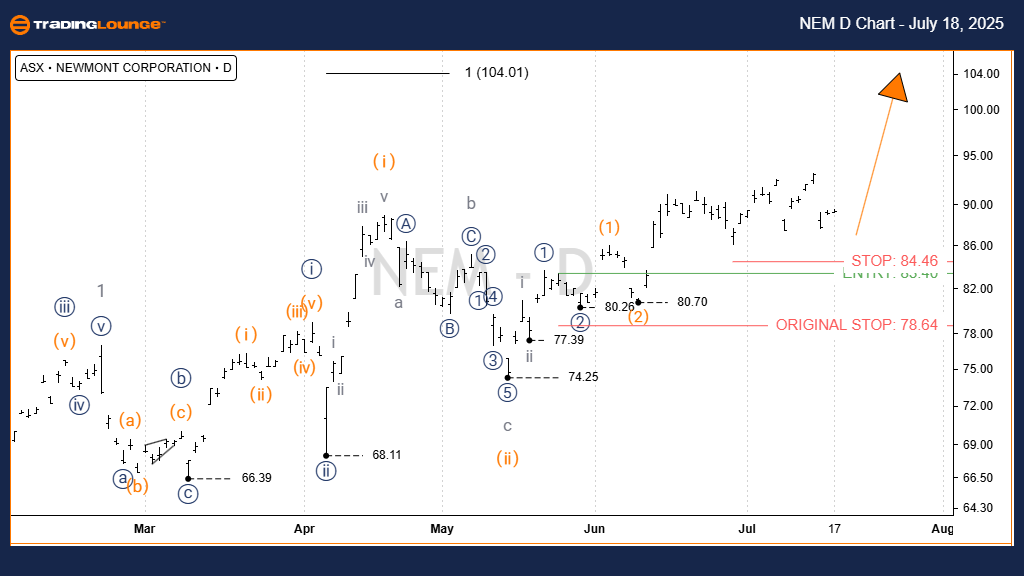
NEM Elliott Wave technical analysis
Today’s Elliott Wave analysis covers the Australian Stock Exchange listing of NEWMONT CORPORATION (ASX:NEM). Based on our evaluation, ASX:NEM is progressing in wave three. This analysis includes detailed price targets and key invalidation levels, helping traders recognize when the trend remains valid or when it may reverse.
Function: Major trend (Minor degree, grey).
Mode: Motive.
Structure: Impulse.
Position: Wave iii) orange of Wave iii)) navy of Wave 3 grey.
Details:
Wave ii) orange likely ended near the 74.25 low as a zigzag pattern labeled a-b-c (grey). Since then, wave iii) orange has advanced upward, targeting a high near 100.00.
Invalidation point: 74.25.
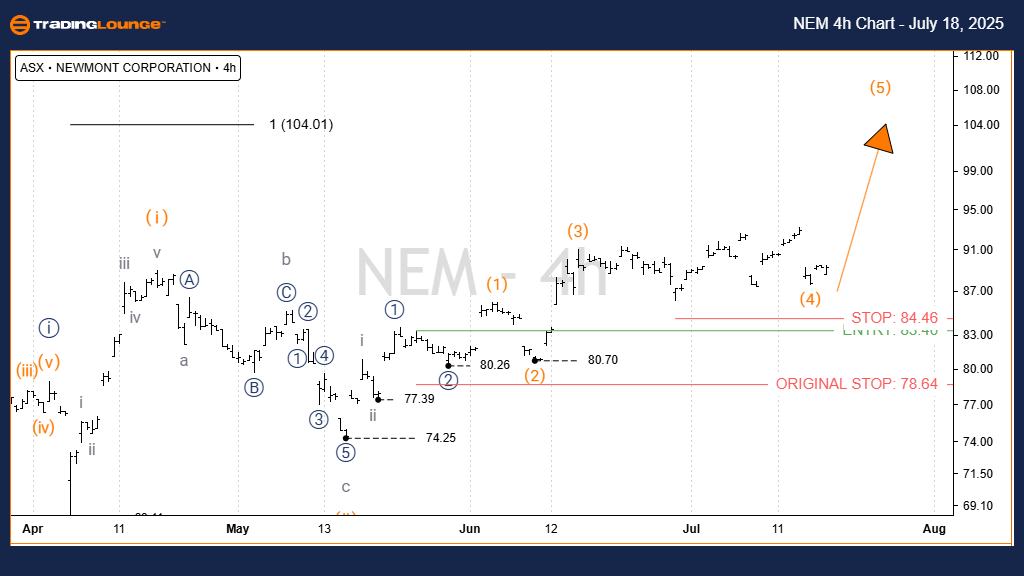
NEM Elliott Wave technical analysis
Function: Major trend (Minor degree, grey).
Mode: Motive.
Structure: Impulse.
Position: Wave iii) orange of Wave ((iii)) navy of Wave 3 grey.
Details:
The 4-hour chart continues to support the 1D view. Wave iii) orange remains in progress toward the 100.00 mark. Additionally, a shorter-term wave iii grey is aiming for a target near 90.00.
Invalidation point: 74.25.
Conclusion
Our current analysis of ASX:NEM provides insight into long-term and short-term market trends. Price levels for validation and invalidation enhance the accuracy of the wave count. This approach allows traders to make decisions based on clearer, more actionable information.
NEM Elliott Wave technical analysis [Video]
Author

Peter Mathers
TradingLounge
Peter Mathers started actively trading in 1982. He began his career at Hoei and Shoin, a Japanese futures trading company.


