Natural Gas price retains upside on supply concerns post-FOMC
- Natural Gas rises as analysts fear supply shortages and hotter weather over the summer.
- US Dollar reverses after June FOMC meeting despite Fed not hiking, as Fed officials signal more hikes may be on the horizon.
- The technical picture is still long-term bearish, although price action throughout most of 2023 has been broadly sideways.

Natural Gas price is trading almost 1% higher on Wednesday as traders fret about possible supply constraints pushing prices up over the summer. Forecasts of hotter weather and supply outages at key fields in Norway – despite robust storage figures – are having the effect of pushing up Natural Gas prices.
A weaker US Dollar in the run up to the June FOMC meeting added further fuel to Natural Gas's uptrend as the commodity is primarily priced and traded in US Dollars. Although the US Federal Reserve (Fed) decided not to raise interest rates as expected at its FOMC meeting on Wednesday, the dot plot, which represents board member's views on the future trajectory of rates showed they on balance expect more hikes before the end of the year. This gave the US Dollar a late stage boost which put a lid on Gas prices, and XNG/USD rotated down from the day's highs.
At the time of writing, Natural Gas is trading at $2.404 per MMBtu.
Natural Gas news and market movers
- Natural Gas price rises on supply concerns – especially in Europe – due to forecasts of hotter weather and supply outages at key fields in Norway, despite storage figures being unusually high for this time of year, according to a report in the Financial Times (FT).
- The FT article sites a pick-up in Asian demand, and more supply disruptions to the remaining Russian pipeline gas flows as further factors supporting Natural Gas prices.
- One Natural Gas trader was quoted as saying, "Everyone knows in the back of their heads that as soon as this gas starts being consumed and if the cargoes keep going to Asia, we are back to the situation two years ago." In the FT article.
- Data from the Permian Basin in the US, the second largest source of Natural Gas in the country, however, showed an increase in production compared to the previous year to a record historical high, according to a report by the Energy Information Administration (EIA).
- “Gross natural gas withdrawals in the Permian region set an annual record high in 2022 at 21.0 billion cubic feet per day (Bcf/d), 14% above the 2021 average,” said the EIA report.
- The US Federal Reserve (Fed) leaves the Fed Funds rate unchnaged as expected, although the Summary of Economic Projections, or dot plot as it is known, suggests more rate hikes in the future, before year end, giving a boost to the US Dollar, which tends to strengthen on higher interest rate expectations.
- Traders will now await EIA Natural Gas inventory data out at 14:30 GMT on Thursday, June 15.
Natural Gas Technical Analysis: Consolidating within broader downtrend
Natural Gas spot price is in a long-term downtrend after turning lower from its peak high of $9.960 MMBtu in August 2022. It continues to make lower lows, though bearish momentum has tapered off considerably since February 2023.
Nevertheless, it is not clear whether Natural Gas price is consolidating before taking a step lower or forming a base from which to launch a trend reversal higher. Unless it can break above the last lower high of the main downtrend at the February 2023 peak high of $3.079 MMBtu, the odds continue to favor the dominant trend and a continuance lower, and shorts favored over longs.
A break below the $2.110 MMBtu lows would solidify the bearish outlook and suggest a continuation down to a target at $1.546 MMBtu, the 61.8% Fibonacci extension of the height of the roughly sideways consolidation range that has unfolded during 2023.
-638223583490675809.png)
Natural Gas: Weekly Chart
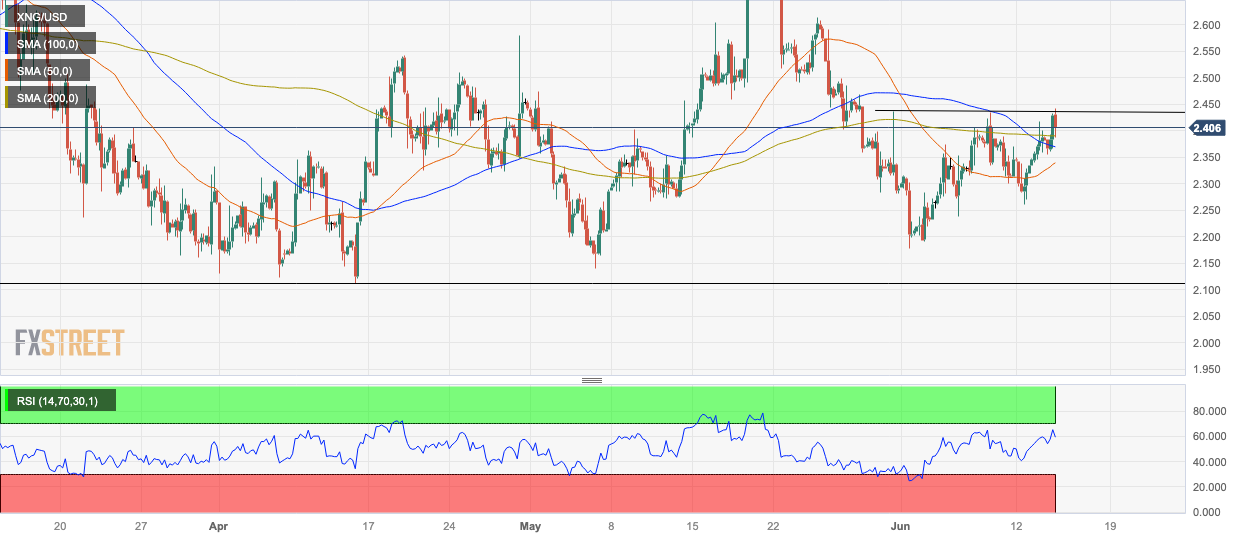
Scoping into the daily chart, it can be seen that price has broken above the 50-day Simple Moving Average (SMA) but has been rebuffed by the 100-day SMA during the early session on Thursday. The 100-day SMA is likely to present a considerable hurdle for bulls and would require a decisive break to overcome.
Decisive bullish breaks are characterized by a break through a level by a longer-than-average green daily candle, which closes near to its high or three green daily candles in a row.
-638223493071214430.png)
Natural Gas: Daily Chart
Looking at the 4-hour chart, a continuation higher in the short term is dependent to a greater degree on price managing to close above the May 31 high of $2.433 MMBtu.
Natural Gas: 4-hour Chart
The Relative Strength Index (RSI) is closely reflecting price, which is bullish. It peaked at the day’s highs compared to the lower June 8 highs when the RSI was also a touch lower. This keeps the torch of hope alive for bears in the short term and there could be further attempts higher.
Natural Gas FAQs
What fundamental factors drive the price of Natural Gas?
Supply and demand dynamics are a key factor influencing Natural Gas prices, and are themselves influenced by global economic growth, industrial activity, population growth, production levels, and inventories. The weather impacts Natural Gas prices because more Gas is used during cold winters and hot summers for heating and cooling. Competition from other energy sources impacts prices as consumers may switch to cheaper sources. Geopolitical events are factors as exemplified by the war in Ukraine. Government policies relating to extraction, transportation, and environmental issues also impact prices.
What are the main macroeconomic releases that impact on Natural Gas Prices?
The main economic release influencing Natural Gas prices is the weekly inventory bulletin from the Energy Information Administration (EIA), a US government agency that produces US gas market data. The EIA Gas bulletin usually comes out on Thursday at 14:30 GMT, a day after the EIA publishes its weekly Oil bulletin. Economic data from large consumers of Natural Gas can impact supply and demand, the largest of which include China, Germany and Japan. Natural Gas is primarily priced and traded in US Dollars, thus economic releases impacting the US Dollar are also factors.
How does the US Dollar influence Natural Gas prices?
The US Dollar is the world’s reserve currency and most commodities, including Natural Gas are priced and traded on international markets in US Dollars. As such, the value of the US Dollar is a factor in the price of Natural Gas, because if the Dollar strengthens it means less Dollars are required to buy the same volume of Gas (the price falls), and vice versa if USD strengthens.
Author

Joaquin Monfort
FXStreet
Joaquin Monfort is a financial writer and analyst with over 10 years experience writing about financial markets and alt data. He holds a degree in Anthropology from London University and a Diploma in Technical analysis.


