|

Natural Gas Price Analysis: XNG/USD struggles to defend bounce off 100-DMA near $2.60

  • Natural Gas remains sidelined after rising the most in a week.
  • Bearish MACD signals, steady RSI prod XNG/USD bulls below three-week-old resistance line.
  • Previous support line, tops marked in June and March prod Natural Gas buyers from retaking control.

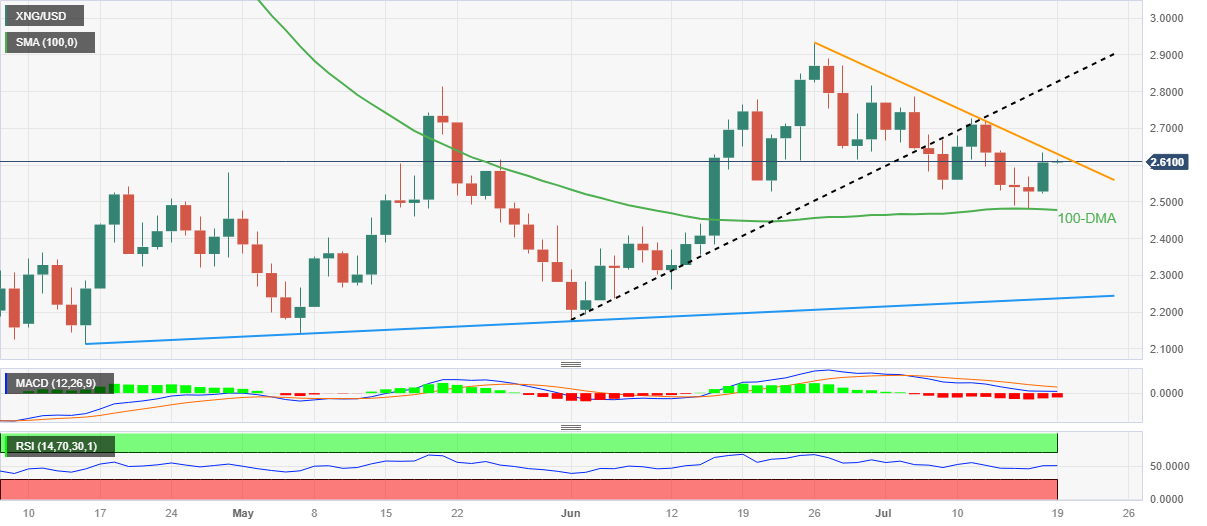
Natural Gas Price (XNG/USD) remains sidelined near $2.60-61 during the early hours of Wednesday’s Asian session, following a stellar rebound from the 100-DMA. In doing so, the energy instrument justifies the bearish MACD signals, as well as the steady RSI (14) line.

Apart from that, a downward-sloping resistance line from June 26, close to $2.63 also challenges the XNG/USD bulls.

Following that, $2.70 and $2.80 round figures may entertain the Natural Gas buyers before directing them to May’s peak of around $2.81.

It’s worth noting that the XNG/USD bulls remain cautious unless witnessing a clear upside break of the seven-week-long previous support line, close to $2.82 by the press time.

Even if the commodity manages to remain firmer past $2.82, the previous monthly high and March’s top, respectively near $2.93 and 3.07 will act as additional upside filters to challenge the buyers.

On the flip side, three-month-old horizontal support near $2.53-52 restricts the short-term downside of the Natural Gas Price ahead of the 100-DMA support of around $2.47.

It should be observed, however, that a daily closing beneath the key DMA won’t hesitate to portray a gradual south-run toward an upward-sloping support line from April, close to $2.23 at the latest.

Natural Gas Price: Daily chart
Trend: Limited upside expected

Author

Anil Panchal

Anil Panchal

FXStreet

Anil Panchal has nearly 15 years of experience in tracking financial markets. With a keen interest in macroeconomics, Anil aptly tracks global news/updates and stays well-informed about the global financial moves and their implications.


More from Anil Panchal
Share:

Editor's Picks

GBP/USD holds range below mid-1.3600s amid Fed risks and Iran tensions

The GBP/USD pair extends its sideways consolidative price move for the second straight day, and trades around the 1.3630 area during the Asian session. The US Dollar is looking to build on its modest recovery from the lowest level since May 14, and is acting as a headwind for the currency pair. The lack of follow-through selling warrants some caution for bearish traders.

EUR/USD gains support amid hawkish ECB expectations, subdued US Dollar

EUR/USD inches higher after posting minor losses in the previous day, trading around 1.1670 during the Asian hours. The pair finds support as rising oil prices, elevated bond yields, and escalating Middle East tensions drive Eurozone inflation concerns. These factors have boosted expectations for a more hawkish stance from the European Central Bank, which is widely anticipated to deliver a 25-basis-point rate hike in September.

$4700 tested as Gold pulls back but bullish potential remains intact
Gold has pulled back sharply from fresh 15-week highs of $4,697, snapping a two-day uptrend in Asia on Tuesday. The US Dollar (USD) holds onto recovery gains, capping further upside in the bullion.
Bitcoin tops $80,000 as US Treasury fights high yields – AERO, VIRTUAL rally

Bitcoin extends gains above $80,000 as broader market risk-on sentiment persists. The scarce asset could extend its rally as the US Treasury combats high yields in the long-dated bond market, with further interventions on the horizon. Aerodrome Finance (AERO) and Virtuals Protocol (VIRTUAL) emerged as top performers over the last 24 hours.

The forex market is switching to a ‘debasement trade’
The US dollar has stabilised near three-month lows thanks to a rapid recovery in Treasury bond yields. Yields on 30-year bonds are returning to the levels seen following the Treasury’s announcement that it was increasing the minimum purchase volume to $4 billion. The greenback got support from falling stock indices, the continued rally in Brent crude, and positive signals from the US economy.
$20 billion offered, $2 billion taken: Why Treasury doubled its buyback cap

The US Treasury moved off its own calendar on Wednesday, and that is the part worth sitting with. At 12:32 GMT, the department said it would at least double the size of liquidity support buyback operations in the 10-year to 20-year and 20-year to 30-year sectors, lifting the maximum from $2 billion per operation to at least $4 billion, effective September 9 and running to November 4.














