Nasdaq (NDX QQQ): More work to do than the S&P but on course for fresh records
- Nasdaq remains in buy-any-dip mode as it lags the S&P500.
- Small resistance at 13,800 should give way to new highs.
- Double bottom in place from May 12 and May 19.

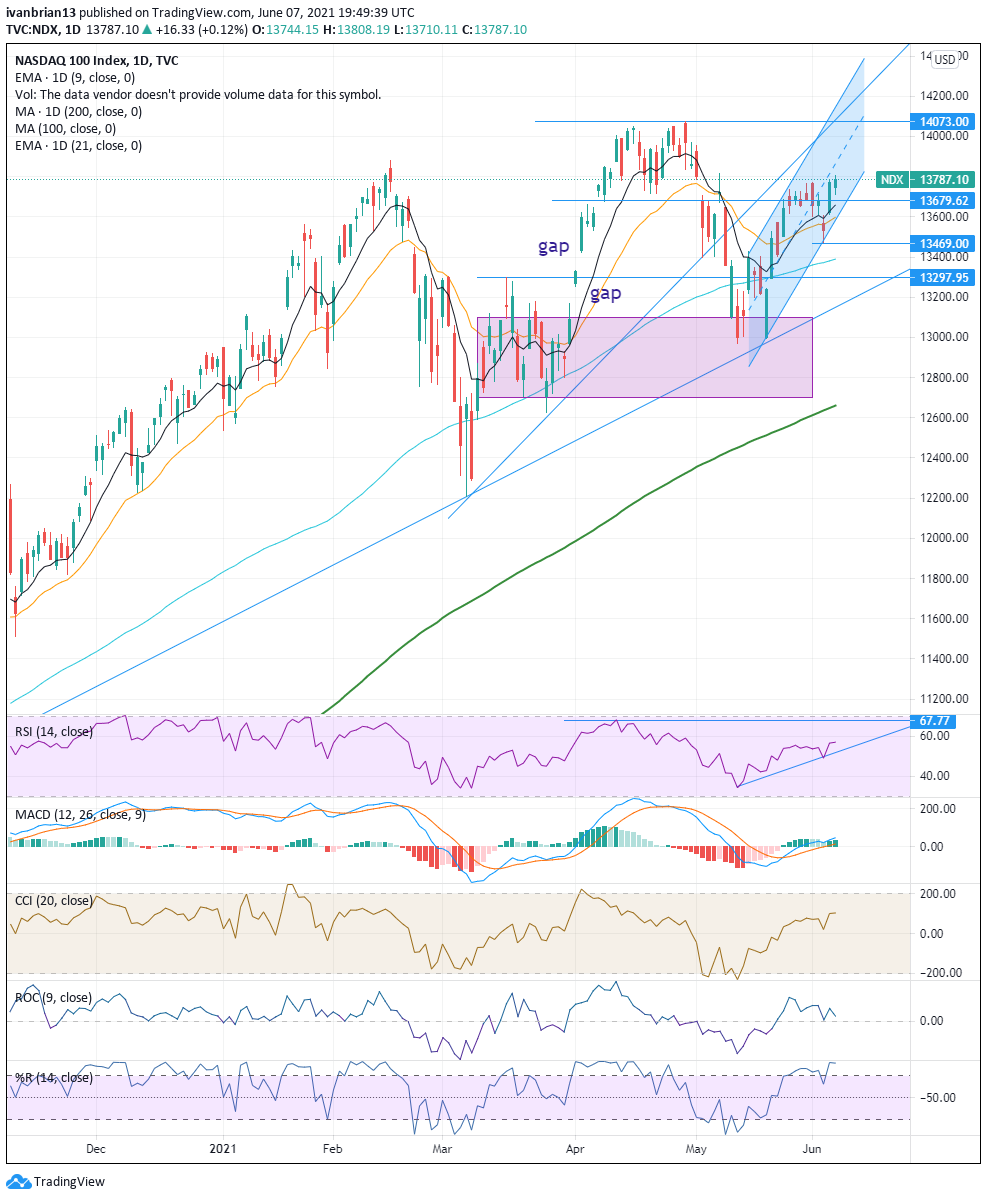
The Nasdaq continues to steady itself for a push to new highs as long as it remains in the current bullish setup. Clearly identifiable are the classic higher lows and higher highs. The Nasdaq is also trading above its 9 and 21-day moving averages so the short-term trend is bullish, while the 200-day moving average, an indicator of the longer-term strength, is miles below current levels.
NASDAQ forecast
Last Thursday's small little wobble was quickly corrected by Friday's strong price action, helped by a benign employment report. Thursday saw the 9 and 21-day moving averages broken in what appeared to have bears getting roused. But Friday's action was helped by the fundamental data with yields dropping and talk of tapering and rate rises pushed further out the time horizon. The May 7 high of 13,814 now offers some interim resistance before a push for new highs.
This recent move was instigated by the bullish double bottom from May 12 and 19 with corresponding divergences from the momentum oscillators, Relative Strength Index (RSI), Commodity Channel Index (CCI) and Williams %R. A bullish divergence occurs when the stock or instrument makes a low but the RSI, CCI, and or Williams %R does not make a confirming (or corresponding) low. In this case, none of the three RSI, CCI or Williams %R made a corresponding low on May 19. The 13,469 level is holding the short-term bullish trend, while 13,000 holds the longer-term bullish pivot. The Moving Average Convergence Divergence (MACD) remains in a bullish crossover and the momentum oscillators are in neutral territory.
The strong consolidation support zone identified by the purple box area worked well back in mid-May as the Nasdaq found strong buyers. A consolidation zone has strong price discovery and should lead to stabilization on a retest. The break from this zone back in March 31-April 2 was accompanied by some gap ups with limited price discovery. It was no surprise then that on the way back down on May 10-12 that the sell-off intensified as there was no price discovery to halt the slide.
Above 13,800, there is a consolidation area, so the test of new highs may be slow and steady.
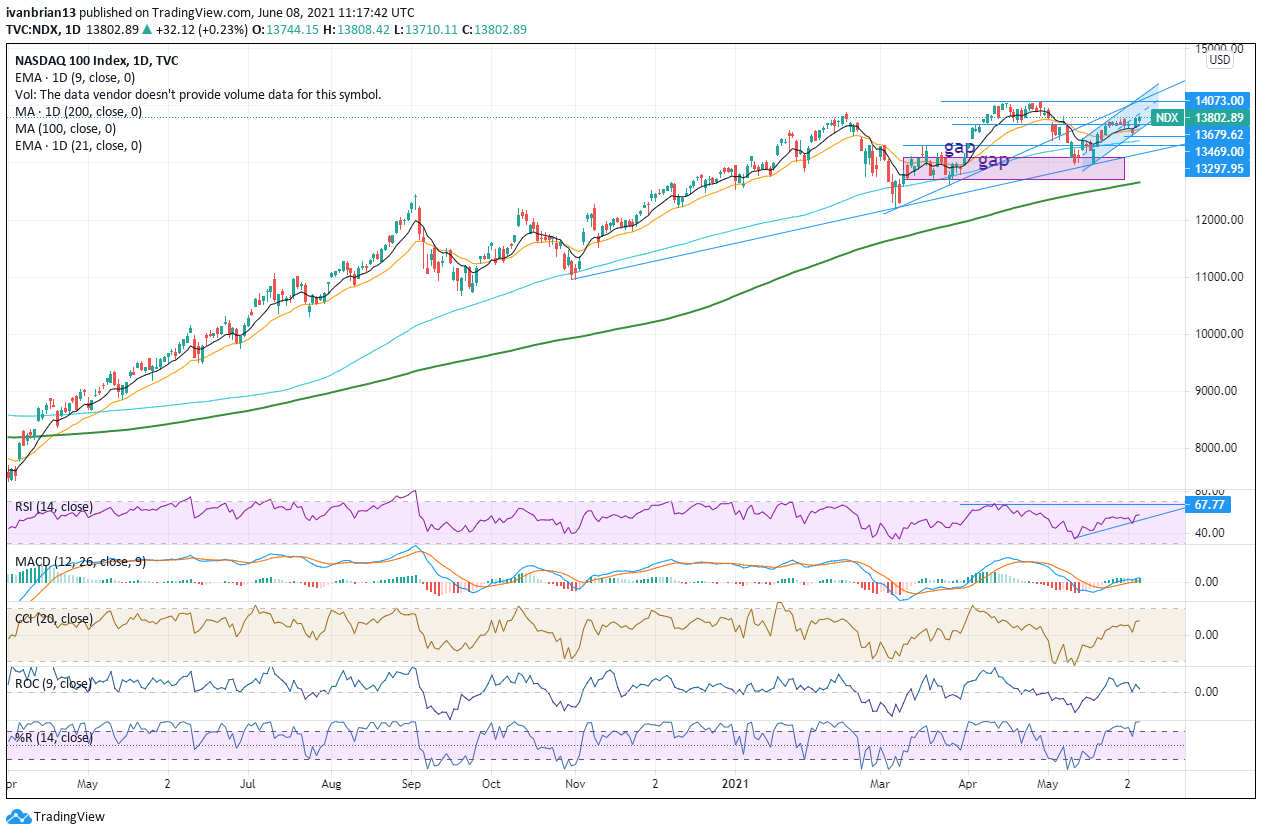
Zooming out on the chart a bit gives us a clearer view of the longer-term picture and the strong trend in play since the pandemic lows. The Nasdaq has been held nicely by the uptrend from the October 30 low and this trend line was retested and held on March 5 and May 19. That is currently a strong support line but is now at 13,200, a good zone to try long positions if NASDAQ traded down there. That said, any short-term move above 13,469 on a risk-reward situation favours the bulls.
| Support | 13,653 9-day MA | 13,469 pivot short term | 13,200 trendline | 13,000 support zone | |
| Resistance | 13,800 | 14,073 | 14,230 trend channel |
Author

Ivan Brian
FXStreet
Ivan Brian started his career with AIB Bank in corporate finance and then worked for seven years at Baxter. He started as a macro analyst before becoming Head of Research and then CFO.


