Nasdaq 100 rebound looks strong… or is it just a trap?
- The Nasdaq 100 rebounds sharply off the 24,307 range low, but price still sits inside a 4H consolidation with no breakout confirmation.
- Tech sentiment improves, but Fed uncertainty and delayed U.S. data continue to cap upside momentum.
- A breakout only materializes above 25,284; failure there risks a full rotation back toward 24,307.
Nasdaq 100 overview – Performance at a glance
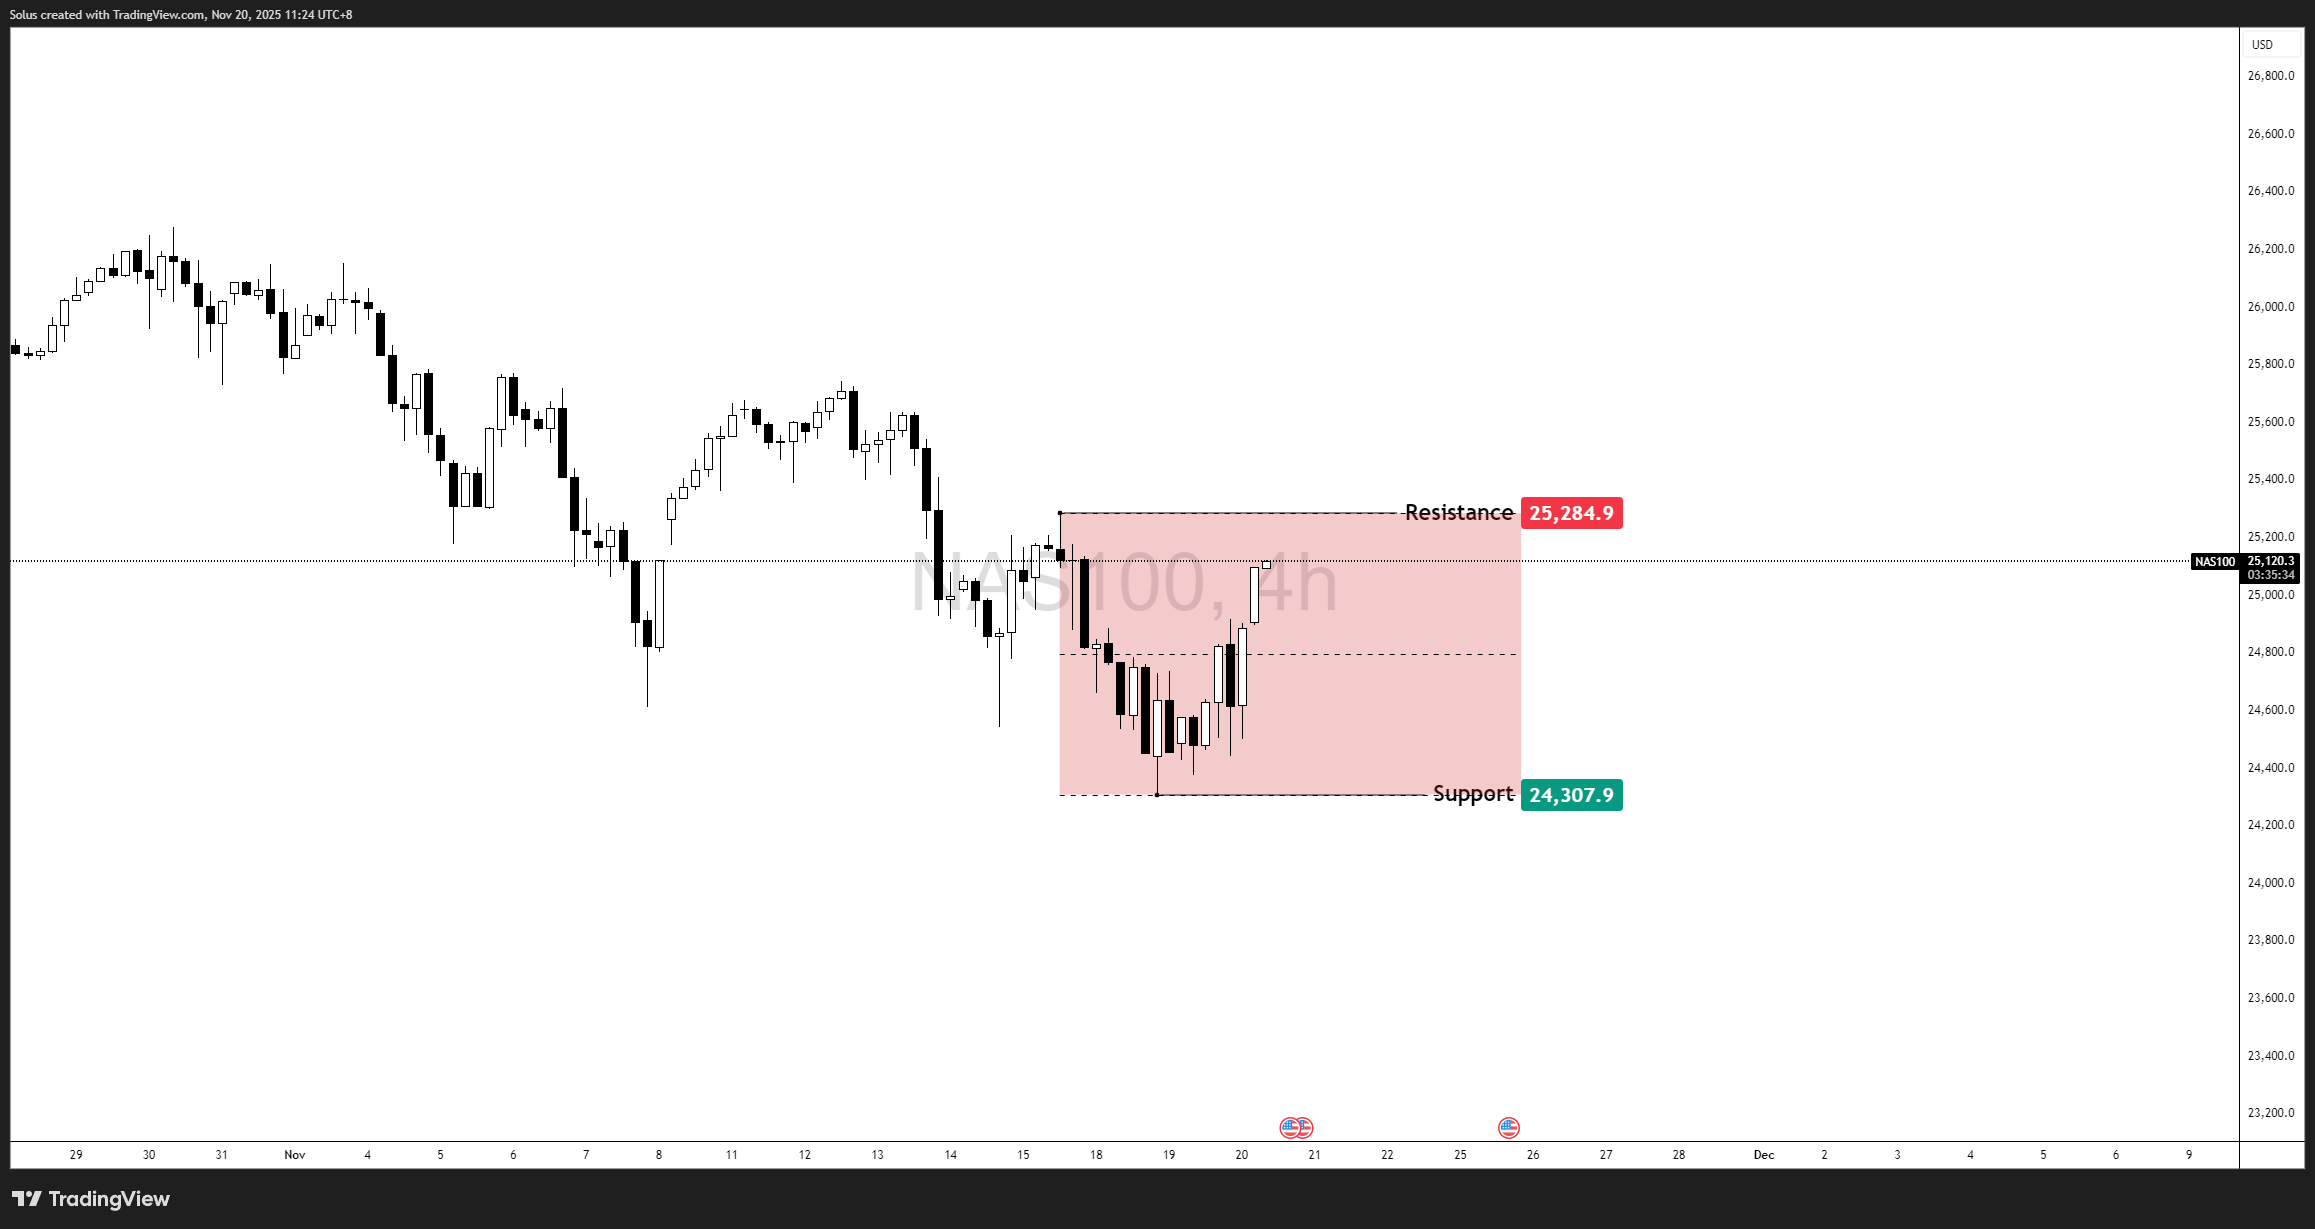
The Nasdaq 100 spent the past few sessions recovering strongly from its November lows, rebounding from 24,307 and climbing back into the 25,100–25,150 mid-range zone. While the candles look convincing, the broader picture reveals a different story: the index remains trapped inside a 4H range structure, boxed between 24,307 (support) and 25,284 (resistance).
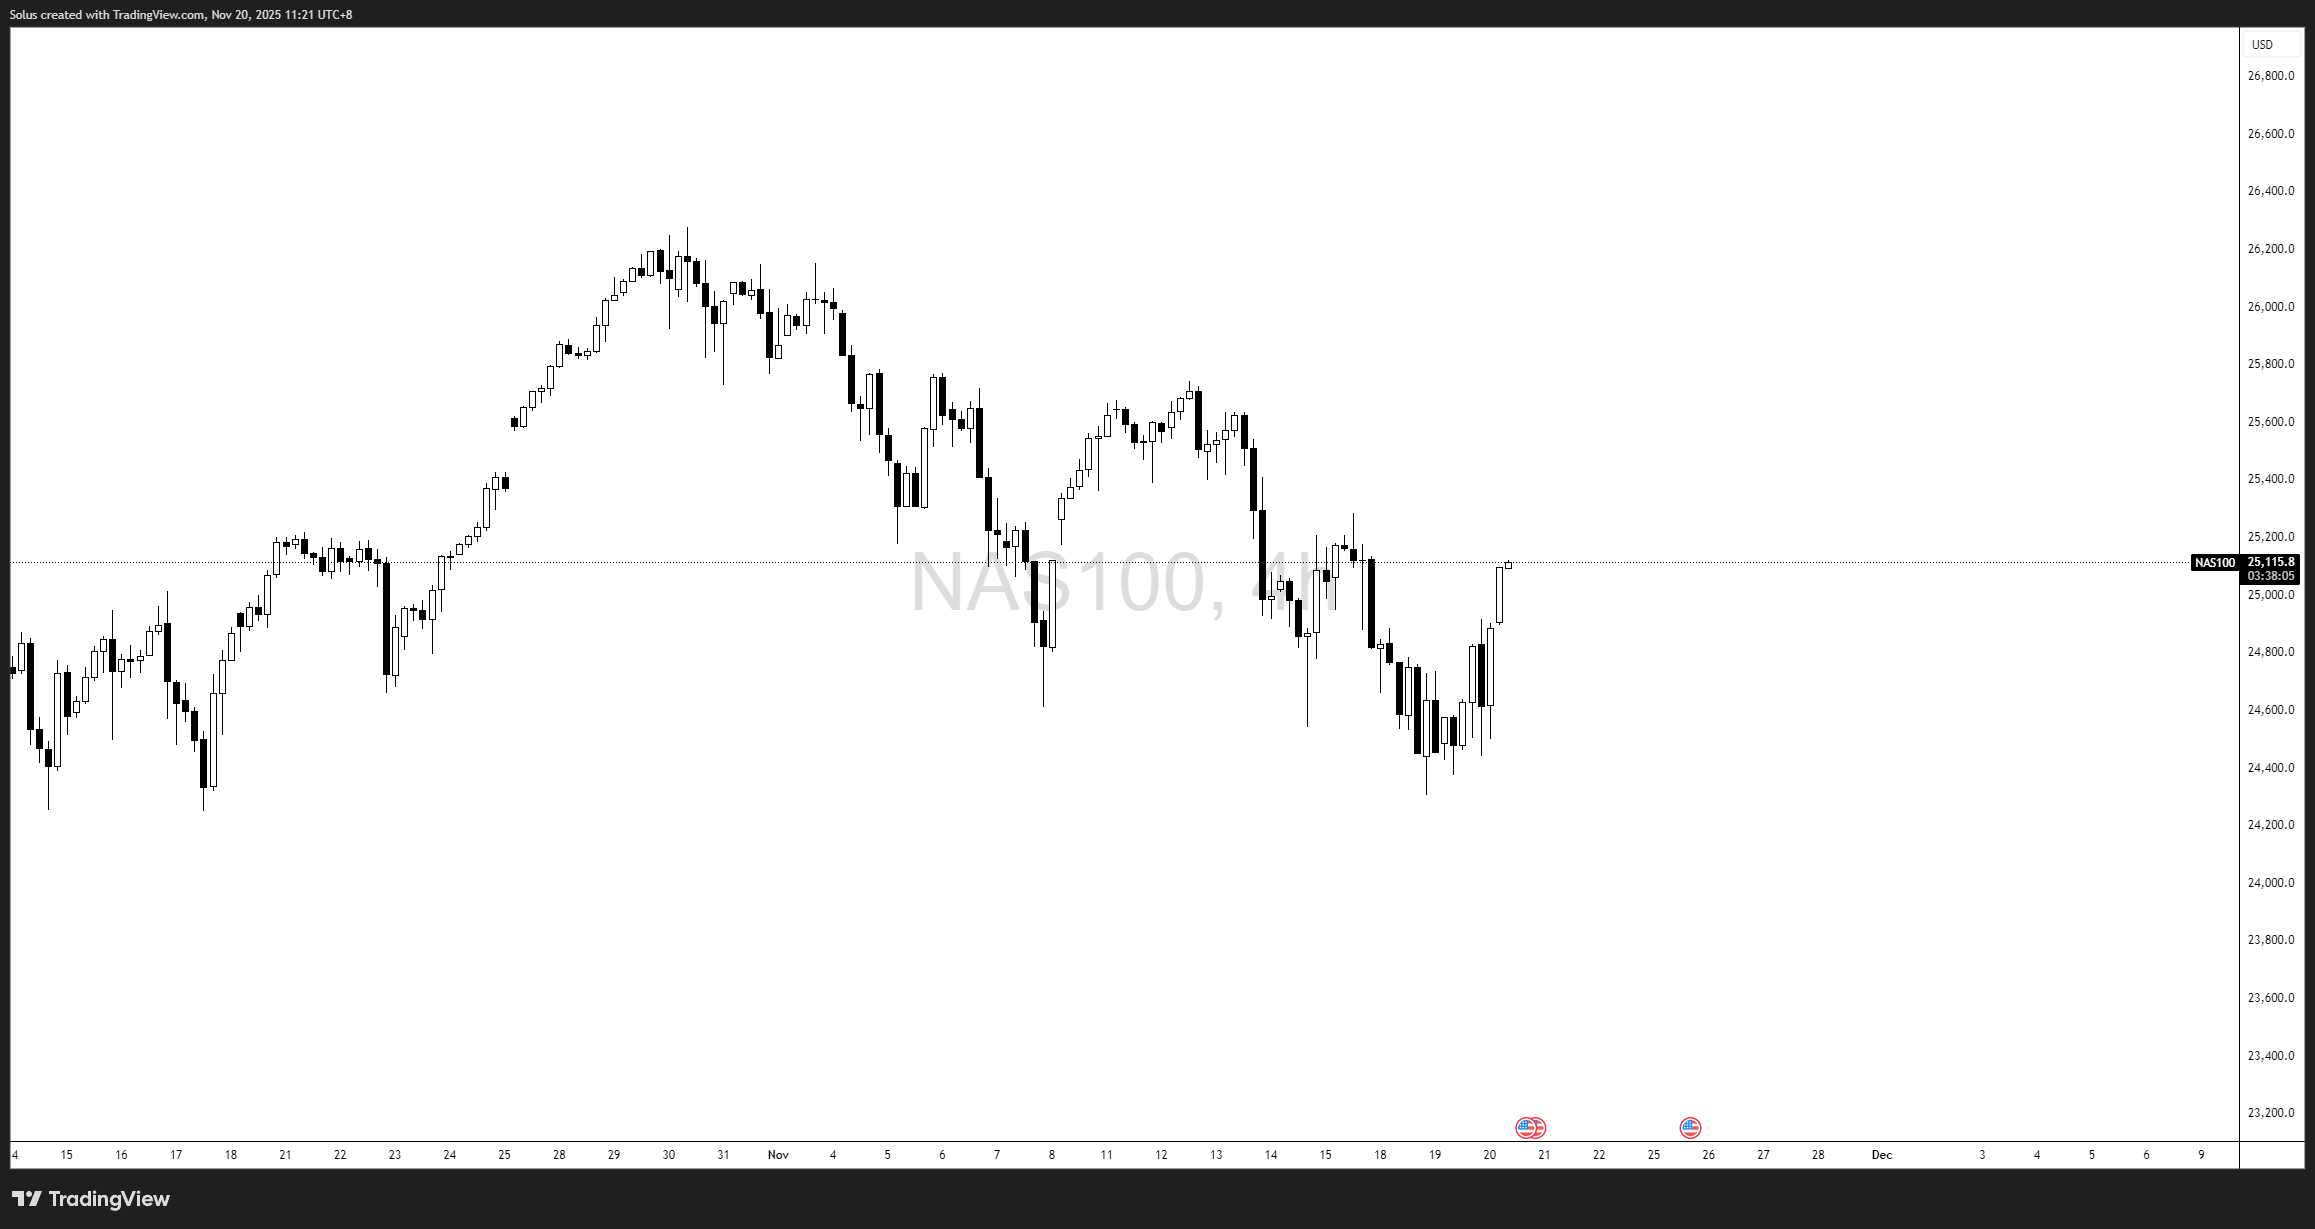
This means the rebound is impressive—but still unconfirmed. Until price breaks the range high, the move remains corrective rather than trend-defining.
The question traders are now asking:
Is this the start of a real recovery, or just another trap inside the box?
Nasdaq strength and weakness narrative
Strengths supporting the bounce
- Strong reaction at 24,307
This zone continues to hold as firm demand, with clear willingness from buyers to defend the level aggressively. - Tech sentiment stabilizing
Megacap and AI names are seeing renewed bids, giving the Nasdaq a foundation for recovery. - No new adverse macro catalysts
Despite the government shutdown and delayed U.S. economic releases, new risk-off triggers are absent for now.
Weaknesses limiting the upside
- Price still below 25,284 resistance
This ceiling defines the entire range. Without a break, the narrative stays neutral. - Corrective, not impulsive structure
Current candles push upward, but not with the momentum normally associated with trend reversal. - Uncertain macro environment
Fed messaging, liquidity stress, and missing data due to the shutdown make institutions hesitant to fully commit.
Taken together, Nasdaq is strong in the short term, weak in the broader context, and stuck between confirmation and doubt.
News impact – What’s driving the current move
While the micro backdrop of tech strength helps the rebound, the macro landscape remains blurry:
- Fed tone remains pivotal
Slightly hawkish shifts or concern about liquidity can quickly stall tech rallies. - Shutdown-induced data delays
With labor and inflation releases at risk of disruption, traders lack full visibility, forcing reliance on sentiment over data. - Risk appetite improving but cautious
Investors are willing to buy dips but not chase highs without macro clarity.
This aligns with what we’re seeing in price: a bounce, not yet a breakout.
Technical outlook – Nasdaq 100
Key levels
- Resistance: 25,284.9
- Support: 24,307.9
- Current Zone: 25,100–25,150 mid-range
Price is rotating inside a defined 4H consolidation box. Your charts clearly outline two scenarios: a bullish breakout continuation or a bearish range rotation.
Bullish scenario – Break above 25,284 to confirm trend continuation
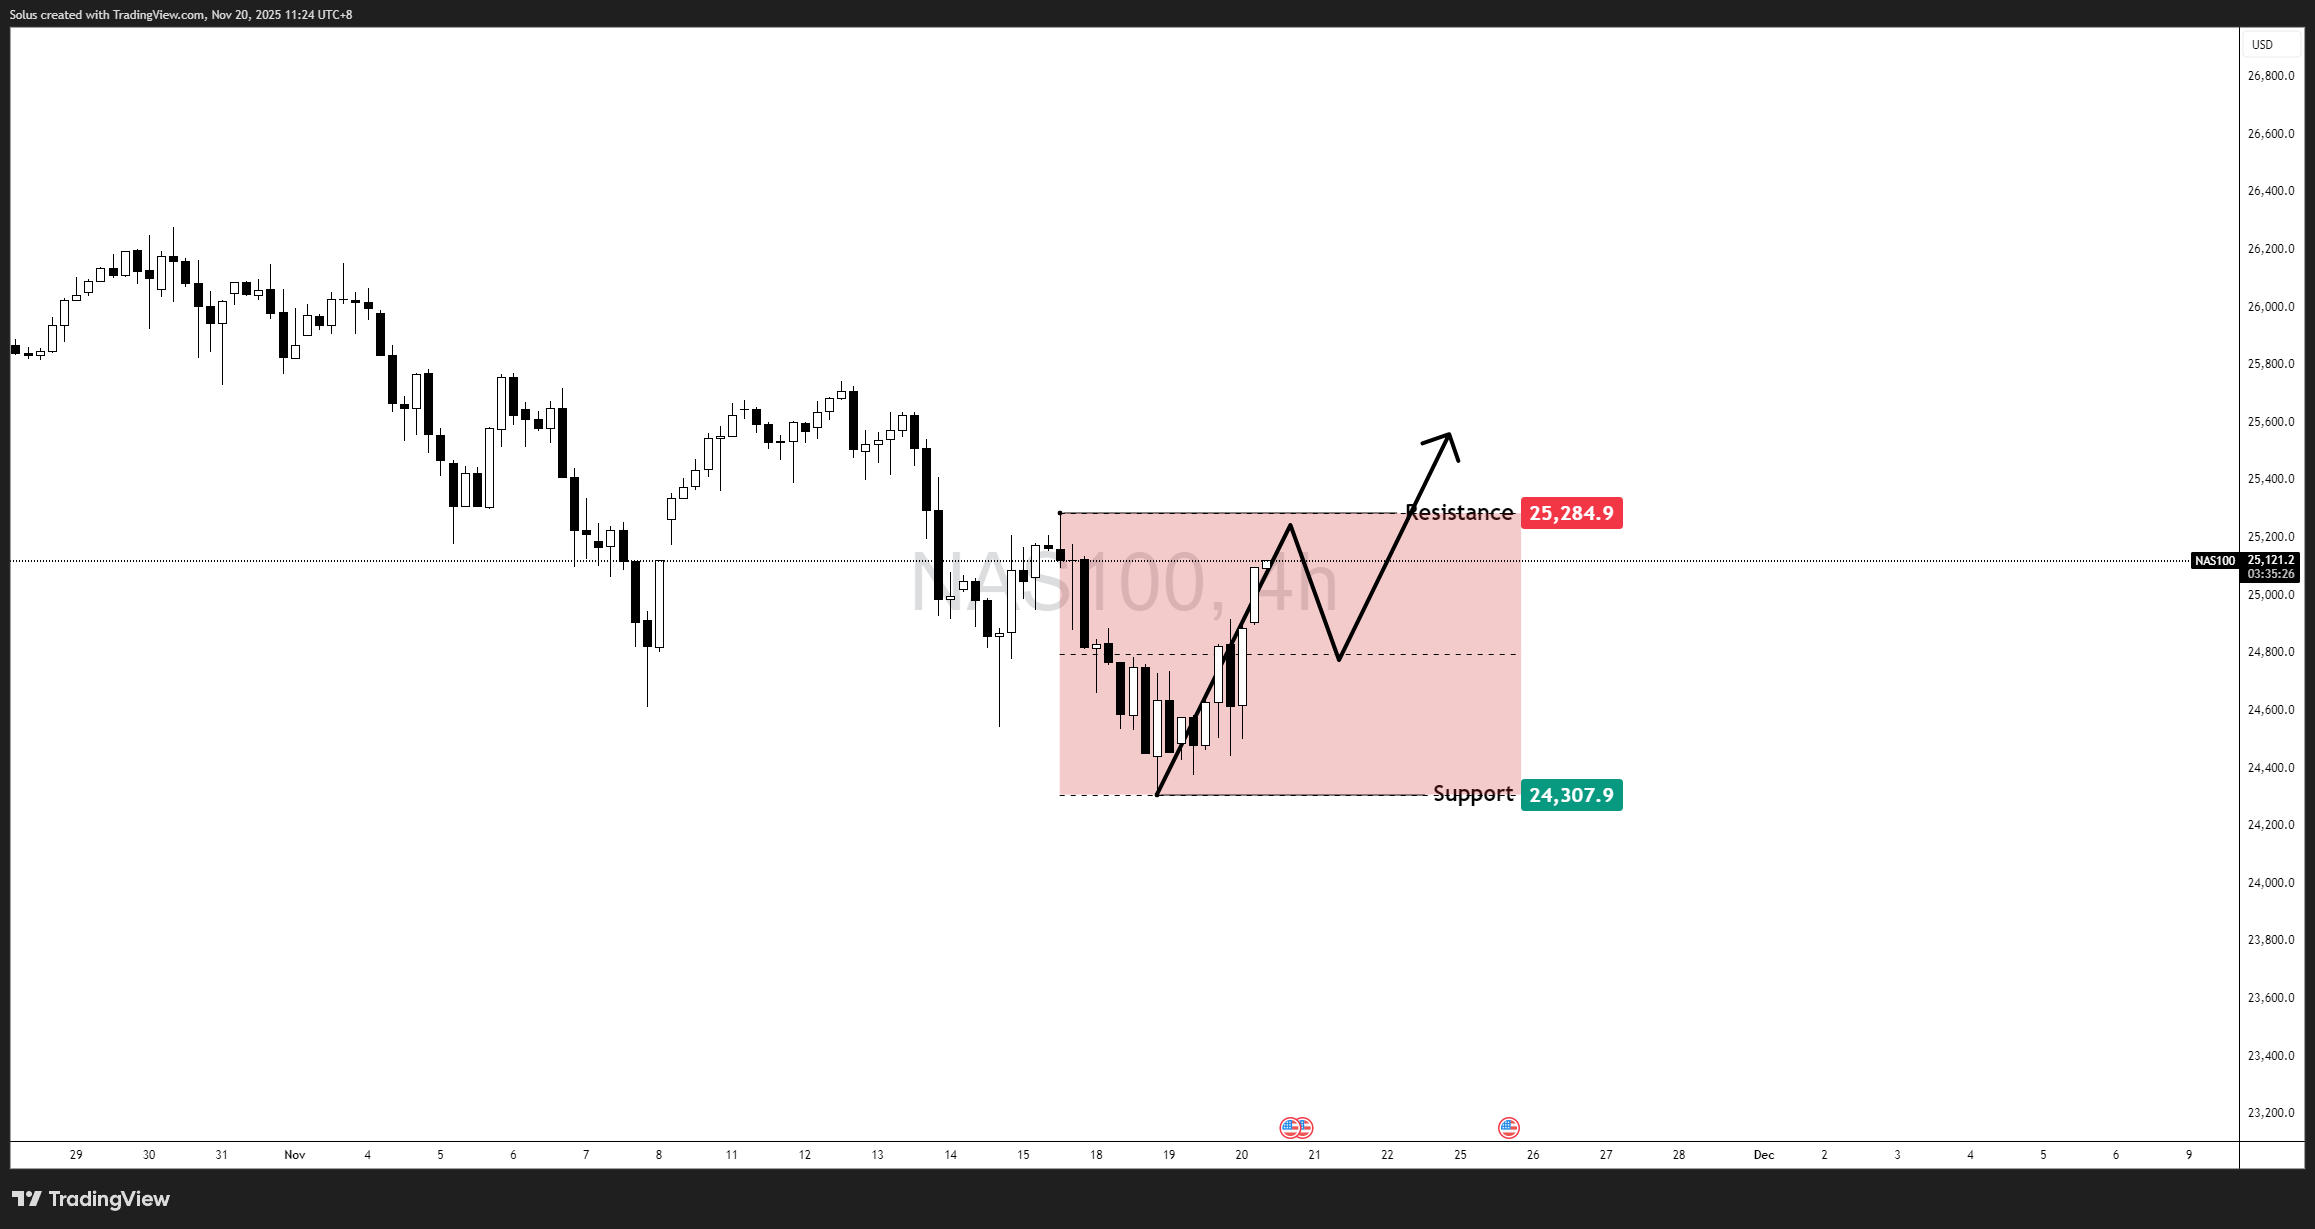
The rebound becomes a real breakout only if Nasdaq:
- Breaks and closes above 25,284
- Retests and holds above the level
- Builds a higher-timeframe structure to continue upward
If this plays out, the market shifts from neutral to bullish with upside potential.
Bullish targets
- 25,450 – first inefficiency
- 25,700–25,800 – major supply zone
- Potential new highs if tech momentum accelerates
As per your markup, the bullish scenario requires confirmation. No breakout = no long bias.
Bearish scenario – Failure at 25,284 sends price back to 24,307
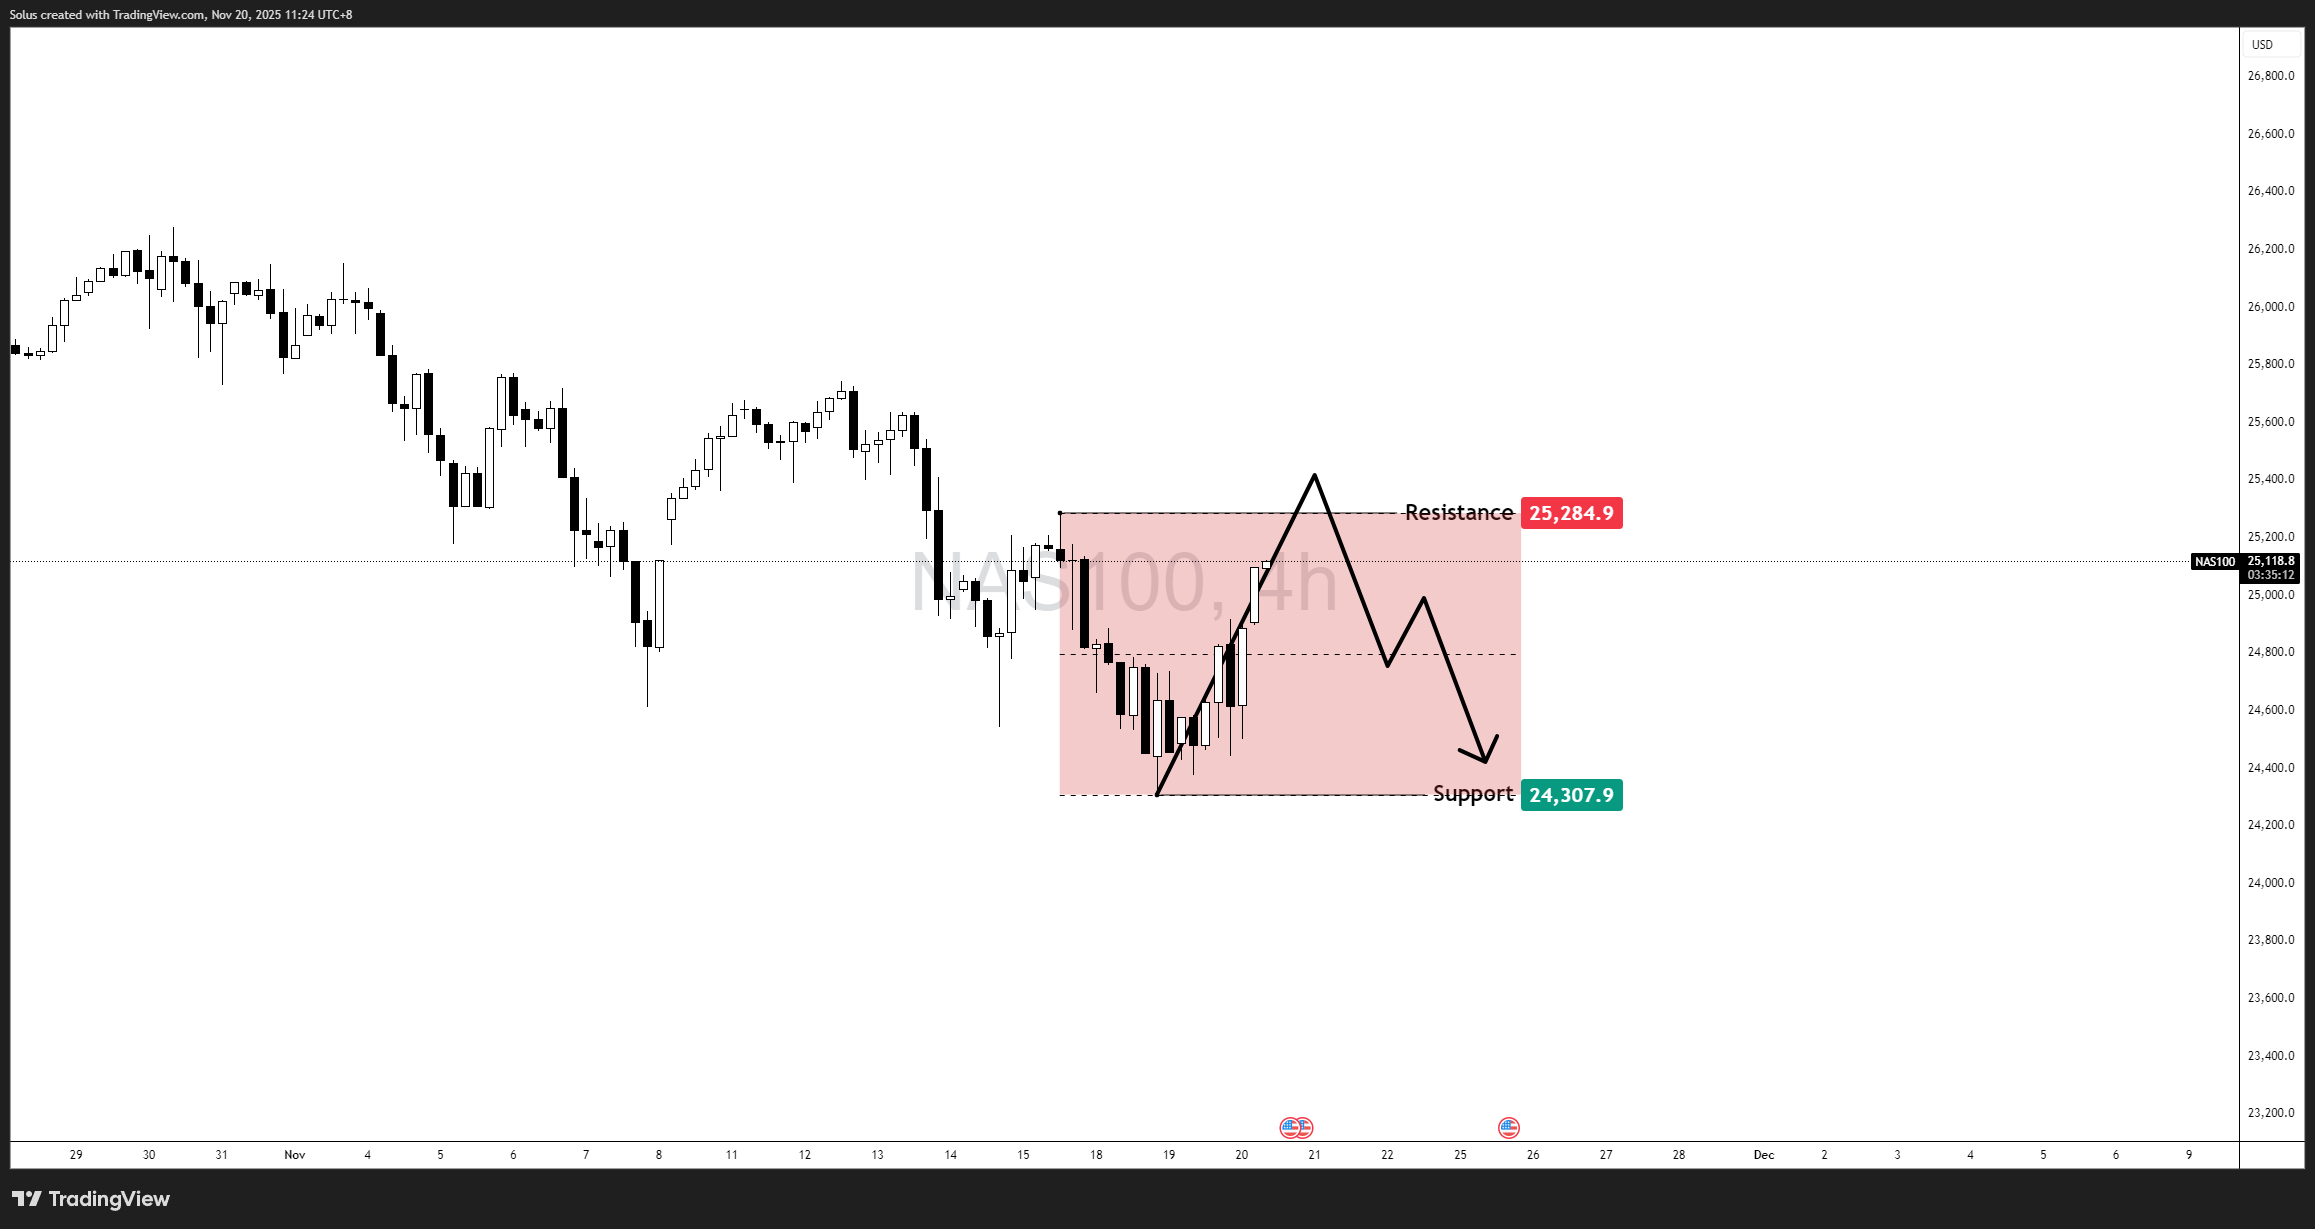
If Nasdaq fails to break the resistance:
- Price forms a lower high
- Momentum stalls at mid-range
- Market rotates downward toward support
This aligns with your projected bearish sweep.
Bearish targets
- 24,850 → 24,600 (intra-day downside pockets)
- 24,307 – full range rotation
- 23,900–24,000 if 24,307 fails
This is where the “trap” narrative becomes valid—strong-looking rebound, but still inside a range that invites a full sweep.
Final thoughts
The Nasdaq 100 rebound looks impressive—but until 25,284 breaks, it remains just that: a rebound inside a box. The market is balanced, reactive, and waiting for confirmation.
- Above 25,284 → breakout confirmed
- Below 25,000 → bullish push losing traction
- Back toward 24,307 → range completes, trap confirmed
For now, traders should treat the Nasdaq as a range market, not a trending one. Patience and confirmation remain the edge.
Author

Jasper Osita
Independent Analyst
Jasper has been in the markets since 2019 trading currencies, indices and commodities like Gold. His approach in the market is heavily accompanied by technical analysis, trading Smart Money Concepts (SMC) with fundamentals in mind.