Nasdaq 100 rally stalling: Will it drop to $21,000 first before reaching $23,000?

As we have maintained a bullish outlook on the stock market and the NASDAQ100 (NDX) since early April, as more price data became available, we demonstrated using the Elliott Wave (EW) Principle that the index would likely peak at around $21400 for an (orange) Wave-3, then decline to $20800+/-100 for a potential (orange) Wave-4, and subsequently rally to $22000+/-200 for a Wave-5 of a grey W-iii/c. See Figure 1 below. The NDX reached $21483 and dipped to $20778 in May, and it is currently trading at $21785, all right on target.
Moreover, the orange 5th wave is subdivided into an overlapping ending diagonal (ED). Last week, the blue W-iii likely peaked at $22041, while the blue W-iv declined to $21591 on Friday. Both fell within the ideal target zones. The index should currently be in the blue W-v, provided it remains above the appropriate warning levels. Blue represents the bulls’ first warning level, also known as a radar lock, at $21730. Gray serves as the second warning level, referred to as a shot across the bow, at $21472. Orange is the third warning for the bulls at $21199, and red indicates where the ship sinks, so to speak; then we move to the alternative EW count, currently at $20032.
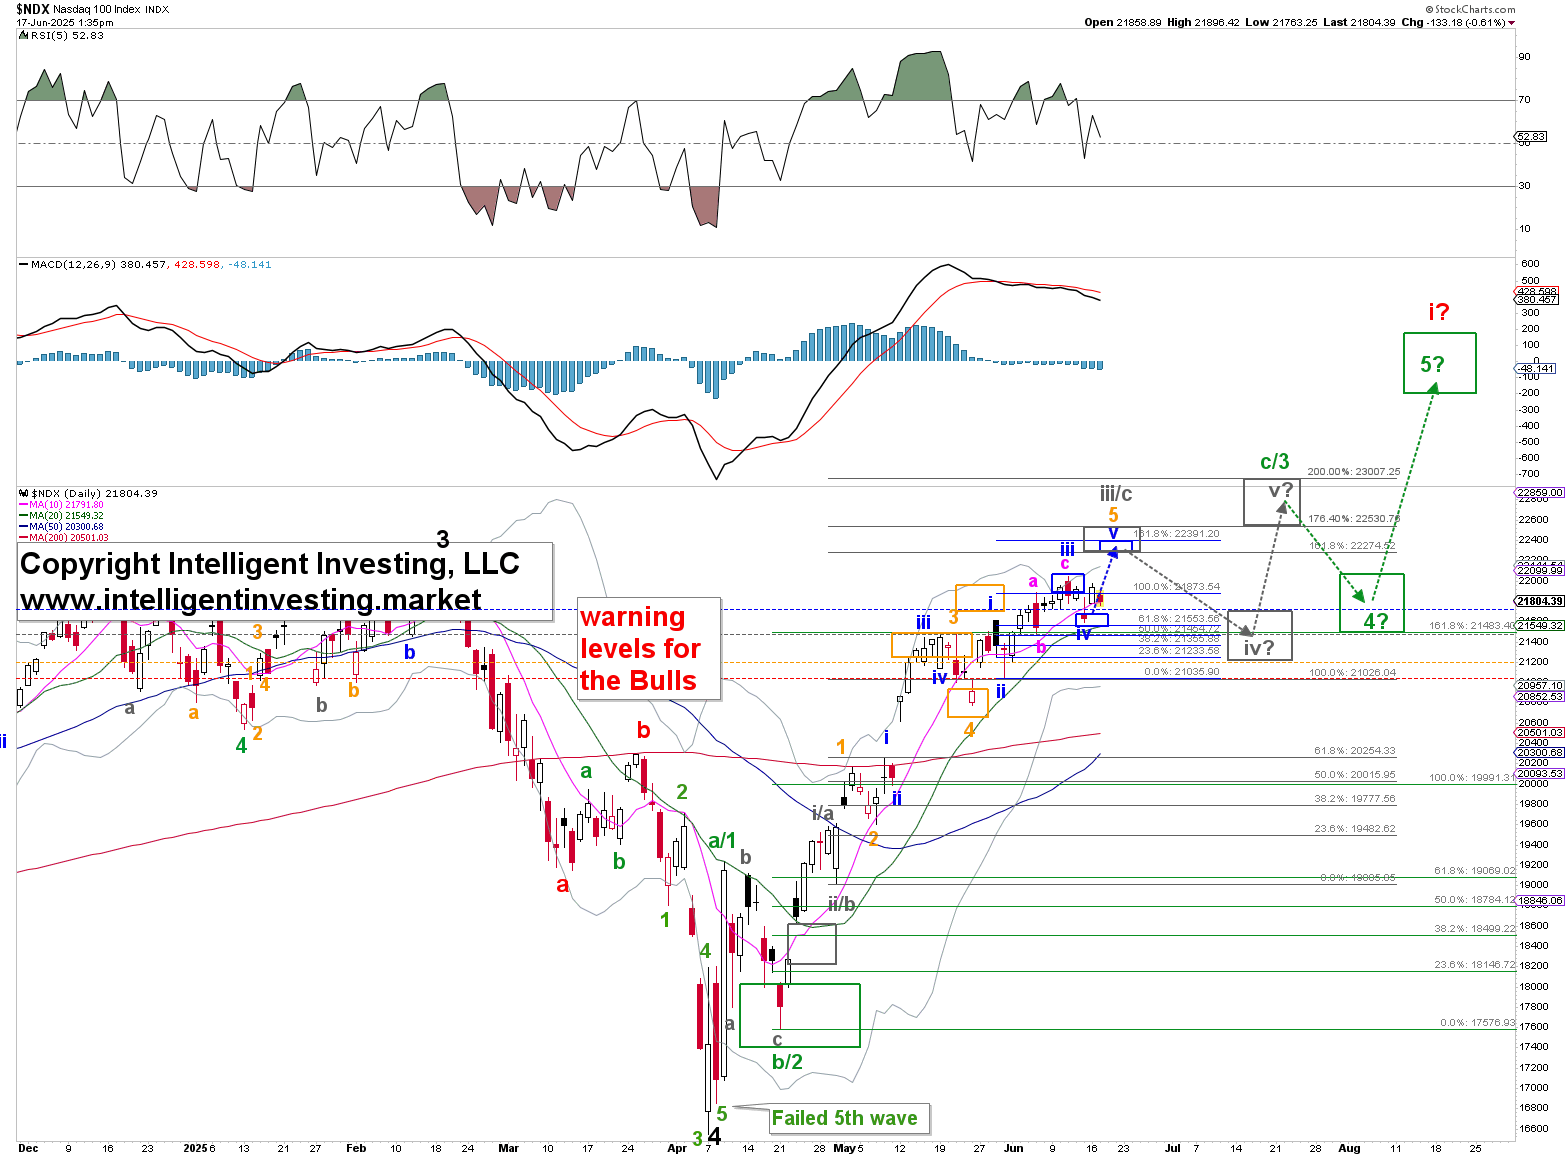
Figure 1. NDX daily chart with our preferred Elliott Wave count and several technical indicators
However, since EDs exhibit overlapping patterns, they can be challenging and less reliable for forecasting. Thus, it may have already peaked, as illustrated in Figure 2 below. As shown, the index did peak near the orange 200.0% Fib extension at $21964, compared to $22041. Additionally, the gray 161.80% Fibonacci extension at $22237, which is a typical W-iii/c target, is also very close. Therefore, the orange W-5 of the gray W-iii/c may have already been completed. This suggests that the index is currently in the gray W-iv, ideally around $20995, before the gray W-v ideally reaches its 200.0% Fib extension at approximately $23095.
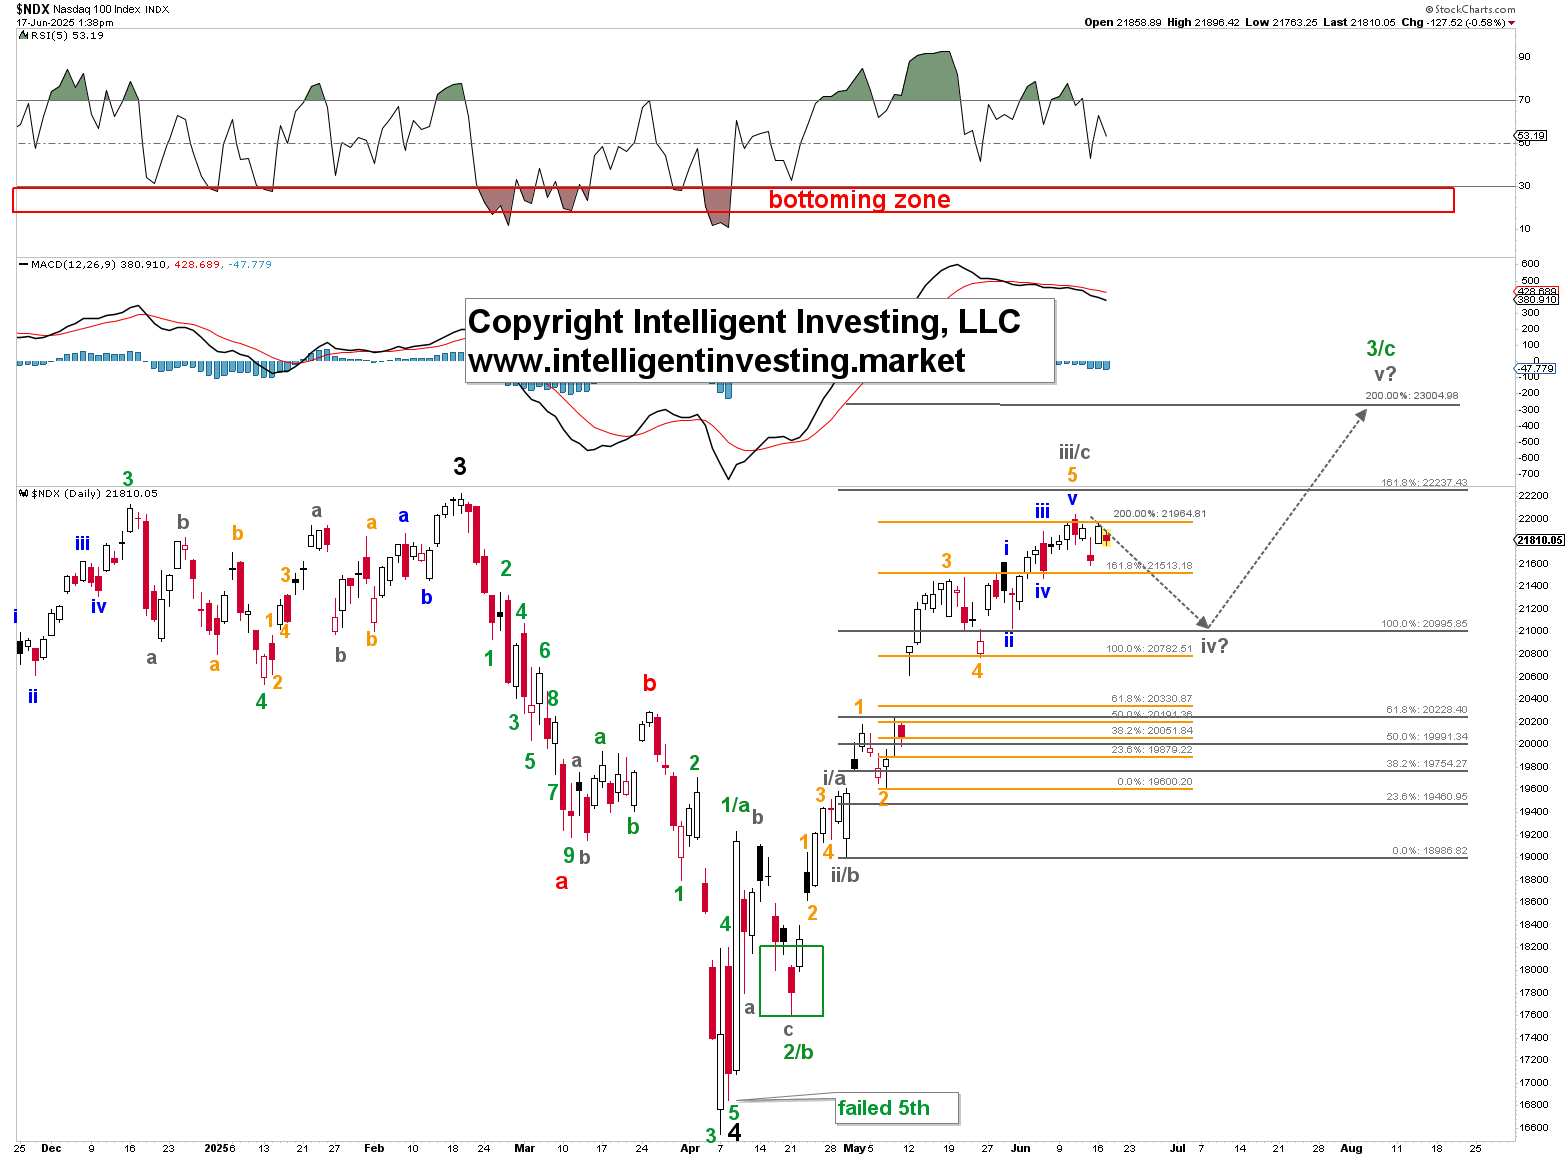
Figure 2. NDX daily chart with our preferred Elliott Wave count and several technical indicators
Understanding our position in the market’s evolving waves is crucial, as it helps us set appropriate expectations. Specifically, the main goal for a trader using the EW is to identify the most profitable wave formations: a third wave or a C wave. It appears that the third or C wave (gray W-iii/c) is approaching its conclusion, one way or another.
Therefore, the easy part of forecasting is now behind us as the index begins to complete its final 4th and 5th waves. However, since the EW is price-based, we can use our warning levels to identify which direction the market will take. If it falls below $21199, we’ll be looking for $20935s. If the index stays above last week’s $21591 low, we can allow it to reach $22275 to $22530 before the next corrective phase—the gray W-iv—begins.
Author

Dr. Arnout Ter Schure
Intelligent Investing, LLC
After having worked for over ten years within the field of energy and the environment, Dr.


