Mullen Automotive stock fails to keep up with Tesla, NASDAQ
- Mullen stock lost 4.6% on Wednesday.
- TSLA shares gained 7.7% at the same time.
- The NASDAQ also rallied 4.4% on the strength of Powell's Fed pivot.
- MULN stock has 43% short interest at the moment.

Mullen Automotive (MULN) stock finds itself falling behind once again. On Wednesday, electric vehicle leader Tesla (TSLA) exploded 7.7% on Federal Reserve Chair Jerome Powell's announcement that the central bank would be looking at smaller interest rate hikes going forward. This appeared to be the "pivot" the entire market had been waiting for, and stocks shot up relentlessly. The NASDAQ, on which MULN stock trades, closed up 4.4% on the session. MULN stock was dead in the water however. Shares of the upstart EV maker contrasted with Wednesday's market sharply, closing down 4.6% at $0.1921.
Mullen Automotive stock news: Short volume growing heavy for MULN
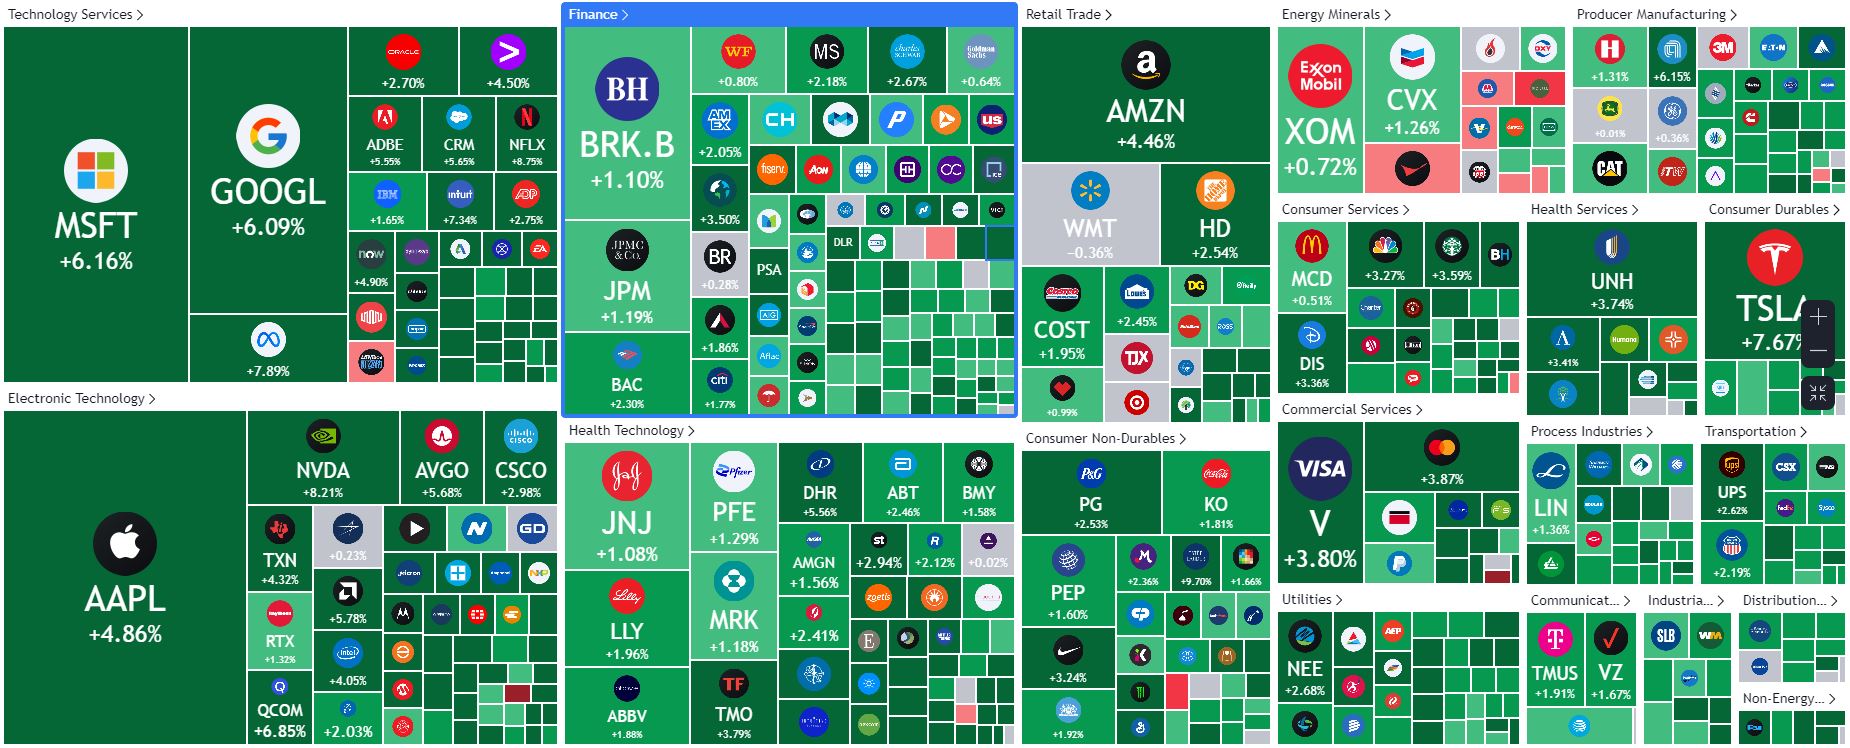
Mullen Automotive stock received little interest from traders on Wednesday as the rest of the market stole all the focus. Taking a look at the S&P 500 heat map below makes it clear that even some of the biggest names in the market took flight. Microsoft (MSFT) and Alphabet (GOOGL) both closed more than 6% ahead, and Nvidia (NVDA) even advanced 8.2%. With that much bullish volatility, there was no need to pay attention to a long-term penny stock play like Mullen. Only a few oil & gas companies closed lower on the day.
A big reason that MULN stock continued to descend was that shares recently dropped below the $0.21 support level that held up back during its recent swing low on October 18 and 19. This time Mullen Automotive stock has ignored the support level and continued moving lower one penny at a time. Of course, it must worry existing shareholders that short interest reached 43% on Wednesday. That is nearly twice as bad as other EV startups. Hyzon Motors (HYZN) and Arcimoto (FUV), for instance, have short interest of 22% and 27%.
Another drag on the MULN share price is that Tesla keeps making all the headlines. Tesla's Texas Gigafactory has been producing 1,000 Model Ys per week since June, but unsubstantiated rumors are leaking that the EV leader will ramp up to 5,000 per week by 2023. Insiders have told the blogs that management is aiming for 75,000 Model Ys to be produced at the Texas plant in the first quarter of 2023. This means 25,000 a month and nearly 5,000 per week.
Additionally, Tesla will deliver its first Tesla Semi, a fully battery electric semi tractor trailer, to Pepsi (PEP) at a Thursday event at its Nevada factory. The Tesla Semi is expected to greatly expand Tesla's profits in the coming years and is said to have a range between 300 and 500 miles. Also Tesla says it uses less than 2kWh to travel one mile, a rather efficient figure. This contrasts sharply with Mullen, who does not plan to deliver its Mullen Five crossover vehicle until the second quarter of 2024. With the recent addition of assets from Electric Last Mile Solutions (ELMS), Mullen is a long way away from completely retooling its new Indiana plant to prepare for production.
Mullen finally closed its $105 million deal to buy the bankrupt ELMS assets on Thursday. The Indiana plant will be used to produce both the Mullen FIVE model and the Bollinger B1 and B2 models.
“I have been working on this plan for many years, putting in place the strategic and critical enablers to be a dominant competitor in the EV market,” Mullen CEO David Michery said. “Successfully completing this asset acquisition moves Mullen into an all-new position with IP, plants and product platforms that no other competitor can offer to both retail and commercial customers. We have everything we need to launch the Mullen and Bollinger EVs product lineup.”
Mullen Automotive stock forecast
As previously stated, MULN stock crashed through the $0.21 support level on November 23 and has not looked back. It would seem that this is now the target for bulls. A move above would signal that a rally is likely starting up. Above that pivot sits nearby points of resistance at $0.2244 from the 9-day moving average and at $0.27 from the 21-day moving average. There is no historical support for MULN stock at the moment, which will be the main worry for bulls. It would be best to wait for a daily close above $0.21 before getting back in. The Moving Average Convergence Divergence (MACD) indicator is also slotted in a bearish pattern.
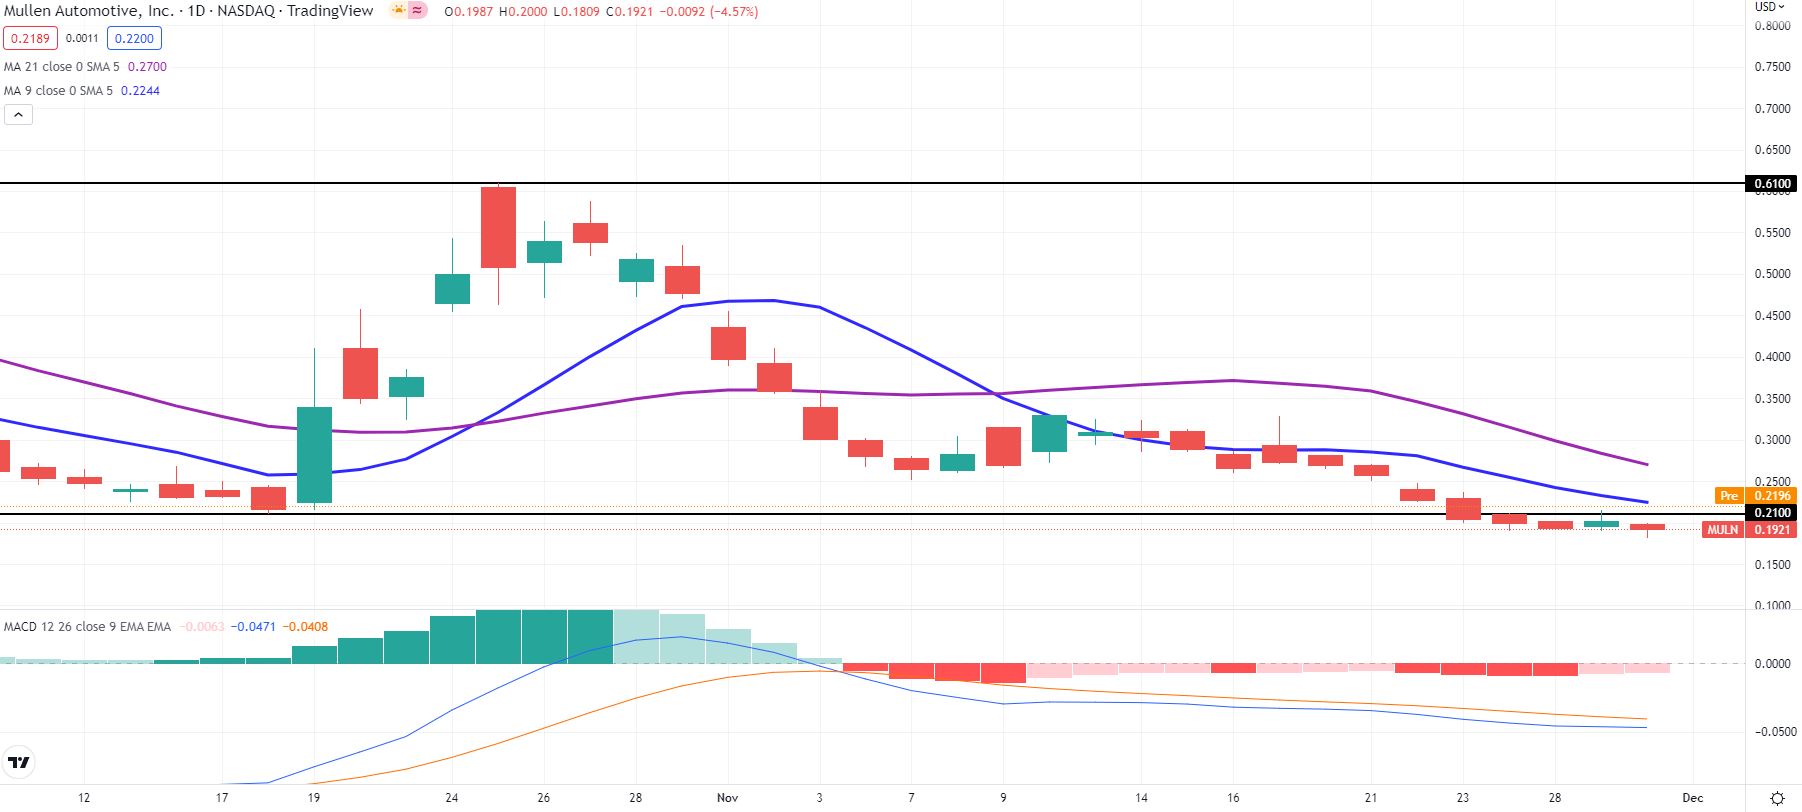
MULN 1-day stock chart
Premium
You have reached your limit of 3 free articles for this month.
Start your subscription and get access to all our original articles.
Author

Clay Webster
FXStreet
Clay Webster grew up in the US outside Buffalo, New York and Lancaster, Pennsylvania. He began investing after college following the 2008 financial crisis.


