|

MicroStrategy (NASDAQ: MSTR) Elliott Wave technical blueprint

MicroStrategy (NASDAQ: MSTR) remains Bitcoin’s largest corporate holder, driving its stellar performance. Yet while BTC tests all-time highs, MSTR trails 20% below its peak – creating a compelling divergence.. In today’s article, we explore MSTR’s Elliott Wave blueprint and outline the bullish paths that may unfold next.

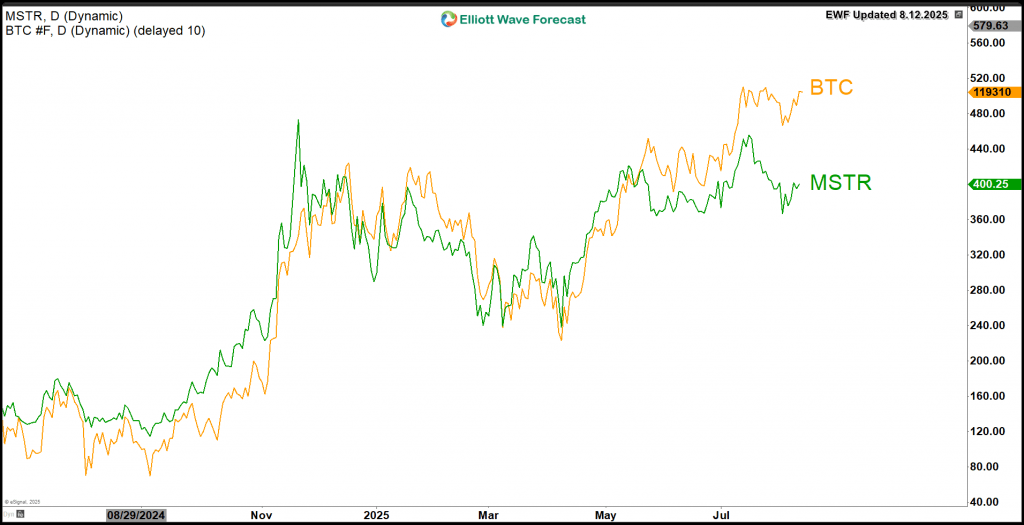
The correlation divergence

MSTR typically outperforms Bitcoin’s moves, offering traders leveraged BTC exposure. Yet recent months revealed troubling divergence. The chart below shows this decoupling clearly.

Two factors could explain the underperformance:

1.      Equity risk premium – Macro concerns weighed on stocks.

2.      Liquidity shifts – Capital rotated to pure-play crypto ETFs.

The key metric to watch: 30-day correlation coefficient (currently 0.82 vs. 0.93 historic average).

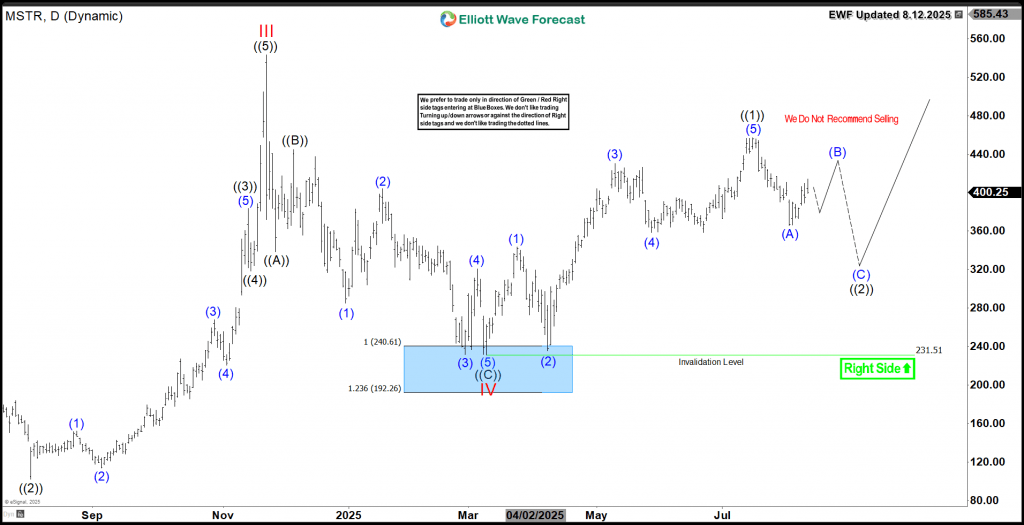
Elliott Wave structure

MSTR completed a zigzag correction from November 2024, hitting the $240-$192 Blue Box target. The subsequent 5-wave advance into July marked Wave ((1)), establishing $231.51 as critical support. Now, any 3/7/11-swing pullback should complete Wave ((2)) before the next surge.

Aggressive traders note August’s dip may have already finished Wave ((2)). A break above July’s $457 peak confirms Wave ((3)) toward $590-$644.

The key question: Will Wave ((3)) restore MSTR’s leverage advantage?

MicroStrategy MSTR daily chart 8.12.2025 

Conclusion: A High-Probability Catch-Up Trade

MicroStrategy (MSTR) maintains its bullish Elliott Wave sequence, poised to close its performance gap with Bitcoin. The stock will build momentum through Wave ((3)), typically the strongest phase. Traders can leverage daily pullbacks using our Blue Box strategy

Author

Elliott Wave Forecast Team

Elliott Wave Forecast Team

ElliottWave-Forecast.com

More from Elliott Wave Forecast Team
Share:

Markets move fast. We move first.

Orange Juice Newsletter brings you expert driven insights - not headlines. Every day on your inbox.

By subscribing you agree to our Terms and conditions.

Editor's Picks

EUR/USD flatlines below 1.1800 amid trading lull, awaits Fed Minutes

EUR/USD trades around a flatline below 1.1800 in European trading on Tuesday. The pair lacks any trading impetus as the US Dollar moves little amid market caution ahead of the Fed's December Meeting Minutes release, which could offer insights into the Federal Reserve’s 2026 outlook.

GBP/USD retakes 1.3500 despite the year-end grind

GBP/USD finds fresh demand and retakes 1.3500 on Tuesday as markets grind through the last trading week of the year. Despite the latest uptick, the pair is unlikely to see further progress due to the year-end holiday volumes.

Gold holds the bounce on Fed rate cut bets, safe-haven flows

Gold holds the rebound near $4,350 in the European trading hours on Tuesday. The precious metal recovers some lost ground after falling 4.5% in the previous session, which was Gold's largest single-day loss since October. Increased margin requirements on gold and silver futures by the Chicago Mercantile Exchange Group, one of the world’s largest trading floors for commodities, prompted widespread profit-taking and portfolio rebalancing.

Tron steadies as Justin Sun invests $18 million in Tron Inc.

Tron (TRX) trades above $0.2800 at press time on Monday, hovering below the 50-day Exponential Moving Average (EMA) at $0.2859.

Economic outlook 2026-2027 in advanced countries: Solidity test

After a year marked by global economic resilience and ending on a note of optimism, 2026 looks promising and could be a year of solid economic performance. In our baseline scenario, we expect most of the supportive factors at work in 2025 to continue to play a role in 2026.

Crypto market outlook for 2026

Year 2025 was volatile, as crypto often is.  Among positive catalysts were favourable regulatory changes in the U.S., rise of Digital Asset Treasuries (DAT), adoption of AI and tokenization of Real-World-Assets (RWA).