McDonald’s stock slides after Q3 comparable sales dip globally
- MCD stock sells off following Q3 results.
- McDonald's beat earnings consensus on Wall Street.
- Comparable sales rose in US but fell globally by 1.5%.
- The view is bearish now that MCD has broken below top trendline.

McDonald’s (MCD) stock shed weight on Tuesday after the fast-food megalith reported third-quarter comparable sales that underwhelmed the market. MCD shares fell initially, dragging the Dow Jones Industrial Average (DJIA) down with it, but recovered fairly well and traded 0.4% lower in the afternoon.
The Dow Jones index traded off 0.15% at the time of writing despite gains in the S&P 500 and NASDAQ. Higher US Treasury yields cut into stock market gains, as well as data showing that US job openings are at their lowest point in nearly four years.
McDonald’s stock news
McDonald’s beat its Wall Street consensus estimates on top and bottom lines in Q3. The company earned $3.24 per share, 3 cents ahead of the average. Likewise, revenue of $6.87 billion was about $50 million above the estimate.
Growth, however, appears sleight if at all. Revenue rose just 2.7% YoY, largely in step with inflation. Revenue from company-operated locations rose 4.2% YoY, while revenue from franchises increased just 1.2% YoY.
Global comparable sales fell 1.5% from a year ago, while they increased 0.3% in the US over that period. CEO Chris Kempczinski said that higher demand for value meals had helped the US comparable figure to turn positive after past weakness.
McDonald’s recently suffered a scare when an E. coli outbreak affected some of its central US locations. However, the CEO said the company has ruled out meat as being the culprit and that the Quarter Pounder was returning to those locations after being halted.
Kempczinski said that investors should look forward to the release of the Big Arch burger and expansion of the McCrispy sandwich into 70 markets.
McDonald's stock forecast
The E. coli outbreak sent MCD stock reeling back below the top trendline that it had only recently overtaken. That trendline began back in May of 2023, and MCD only broke out of it on October 14.
Simply put, expect that most traders will be sellers until MCD falls back to the intersection of the 100-day and 200-day Simple Moving Averages (SMA) near $278. However, a break above the top trendline will upend the bearish thesis.
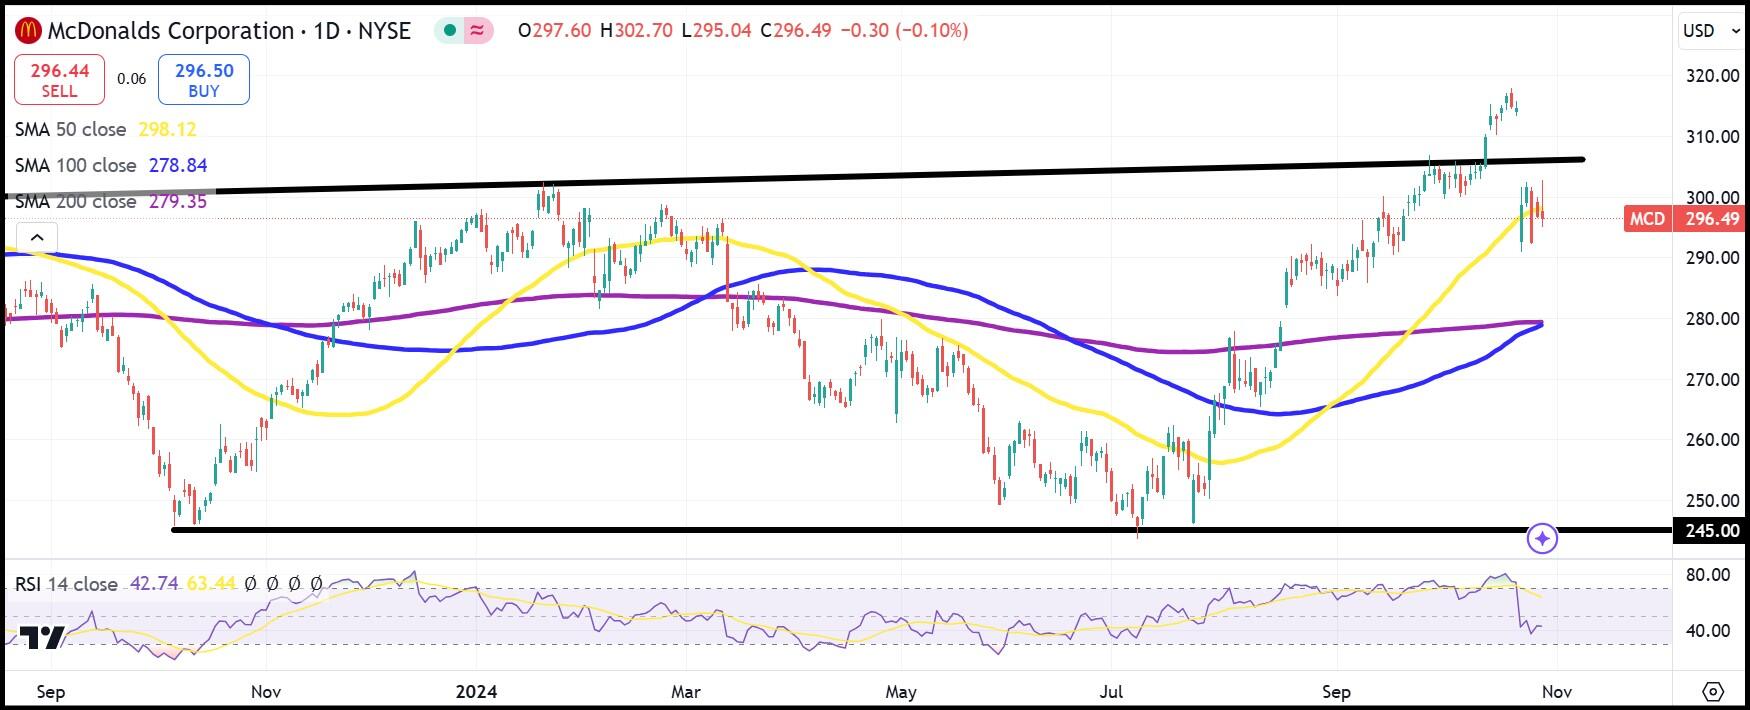
MCD daily stock chart
Premium
You have reached your limit of 3 free articles for this month.
Start your subscription and get access to all our original articles.
Author

Clay Webster
FXStreet
Clay Webster grew up in the US outside Buffalo, New York and Lancaster, Pennsylvania. He began investing after college following the 2008 financial crisis.


