Mastercard Inc. (MA) Elliott Wave technical analysis [Video]
![Mastercard Inc. (MA) Elliott Wave technical analysis [Video]](https://editorial.fxstreet.com/images/Macroeconomics/EconomicIndicator/ConsumerSpending/Consumption/paying-by-credit-card-gm171555949-21665159_XtraLarge.jpg)
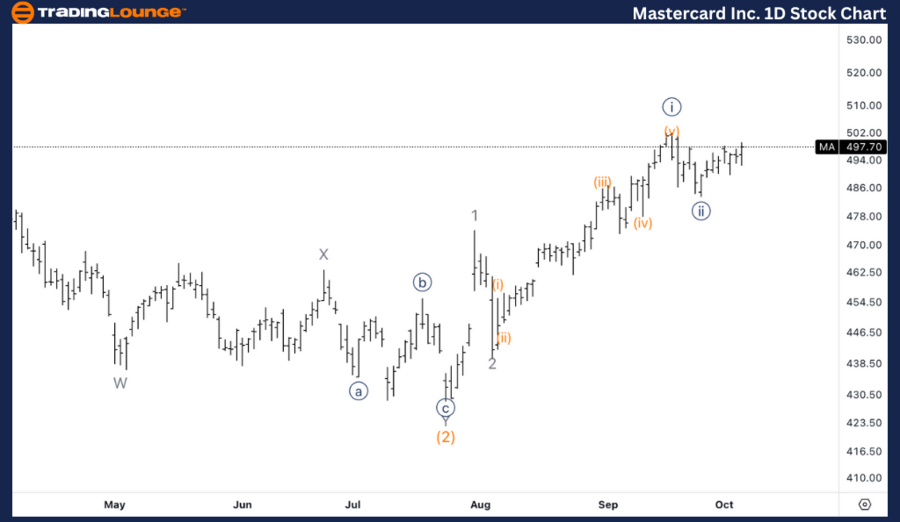
MA Elliott Wave technical analysis
Function: Trend.
Mode: Impulsive.
Structure: Motive.
Position: Minor wave 3.
Direction: Upside within wave 3.
Details: Looking for upside within wave 3 in what could be an extension in wave 3.
META Elliott Wave technical analysis – Daily chart
On the daily chart, MA is in an impulsive mode, currently progressing through Minor wave 3. There is the expectation of upside continuation within wave 3, and there are indications that this wave may experience an extension.
This type of structure, where wave 3 extends, often signifies strong bullish momentum. Traders can anticipate that Mastercard may push to new highs as this extended wave develops, possibly surpassing significant resistance levels. The chart is likely targeting higher prices in this trend, supported by the broader impulsive structure.
MA Elliott Wave technical analysis
Function: Trend.
Mode: Impulsive.
Structure: Motive.
Position: Minute wave {v}.
Direction: Upside in wave {v}.
Details: Here showing the alternative count in what could be a five wave move within minor wave 1.
META Elliott Wave technical analysis – One-hour chart
On the 1-hour chart, Mastercard is currently within Minute wave {v}. The current count suggests an alternative scenario in which wave {v} is part of a five-wave move within Minor wave 1. This count implies that, while we are nearing the end of this smaller wave sequence, there could be additional bullish movement before a larger correction takes place.
As wave {v} completes, traders should watch for signs of exhaustion at resistance levels. However, the overall structure remains supportive of continued upward momentum within the context of the larger impulsive trend.

This Elliott Wave analysis for Mastercard Inc. (MA) examines both the daily and 1-hour charts to assess its current market trend, utilizing Elliott Wave Theory anticipate potential future movements.
Mastercard Inc. (MA) Elliott Wave technical analysis [Video]
Author

Peter Mathers
TradingLounge
Peter Mathers started actively trading in 1982. He began his career at Hoei and Shoin, a Japanese futures trading company.


