Gold dips but holds $5,000 as US Dollar recovers on soft data
- Gold slips despite weak US Retail Sales and softer labor costs signaling slowing economic momentum.
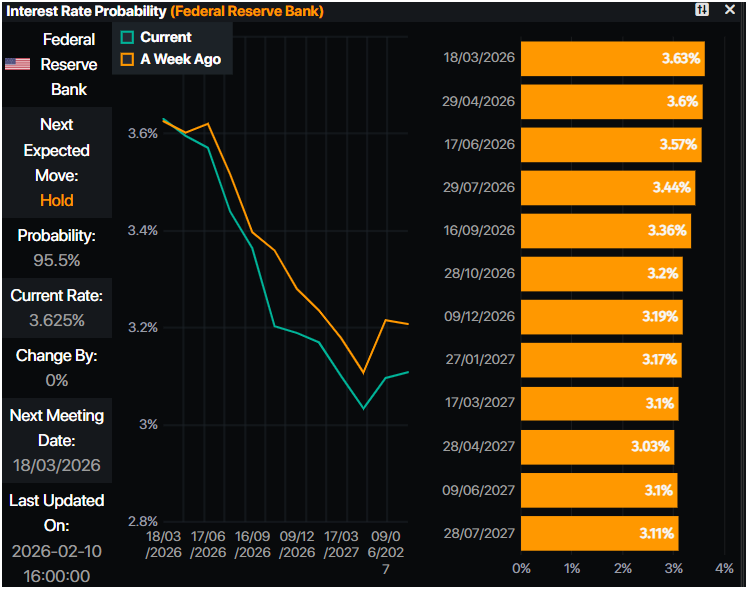
- Fed rate cut bets rise as markets price deeper easing extending into 2026.
- Focus shifts to February Nonfarm Payrolls to gauge labor market resilience or further weakness.

Gold price turns negative during Tuesday’s session, even though worse than expected data in the US pushed investors to trim US Dollar shorts, pushing the yellow metal lower, but remaining above the $5,000 threshold. At the time of writing, XAU/USD trades with losses of 0.72% at $5,022.
XAU/USD slips modestly as traders square Dollar positions despite weaker US consumption and labor cost data
Retail Sales in the US disappointed investors as consumers were spooked by higher prices, along with bad weather. Sales in the control group used to calculate Gross Domestic Product (GDP) figures contracted, following November’s downwardly revised figure.
The Employment Cost Index cooled in Q4 2025, dipping compared to the previous print, an indication that the labor market could be weakening further as the ECI is viewed by Fed officials as a bellwether of labor market slack and a predictor of underlying inflation.
Following the data releases, traders ramped up expectations that the Federal Reserve (Fed) will cut rates in 2026 from 56.5 basis points of easing to 58.5, according to Prime Market Terminal data.
Nevertheless, traders’ eyes are on the Nonfarm Payrolls report coming on Wednesday, February 11. The US economy is foreseen adding 70K people to the workforce in January, well above December’s 50K print. The Unemployment Rate Is projected to remain unchanged at 4.4%.
Daily market movers: Gold fails to gain traction despite US Dollar weakness
- Bullion prices remained capped as the Greenback remains steady. The US Dollar Index (DXY), which measures the performance of six currencies versus the US Dollar, is flat at 96.78, a headwind for Gold.
- Conversely, US Treasury yields are tanking, as depicted by the 10-year T-note trading down five basis points to 4.149%.
- US households reduced spending as December Retail Sales were unchanged at 0% MoM, down from 0.6% in November, missing estimates for a 0.4% increase. Retail Sales for the Control Group shrank -0.1% in December, down from 0.2% in the previous month.
- The Employment Cost Index (ECI) rose 0.7% in Q4 on a quarterly basis, after rising 0.8% in Q3, according to the Department of Labor.
- Gold outlook remains bullish due to the debasement trade and physical buying by central banks, particularly the People’s Bank of China. Data by the PBoC revealed that it added bullion to its reserves for the fifteenth consecutive month.
- White House National Economic Adviser Kevin Hassett hedged against a possible bad reading on jobs data. He said that “we should expect slightly lower jobs numbers.”
Technical outlook: Gold price to trade sideways, glued at around $5,000
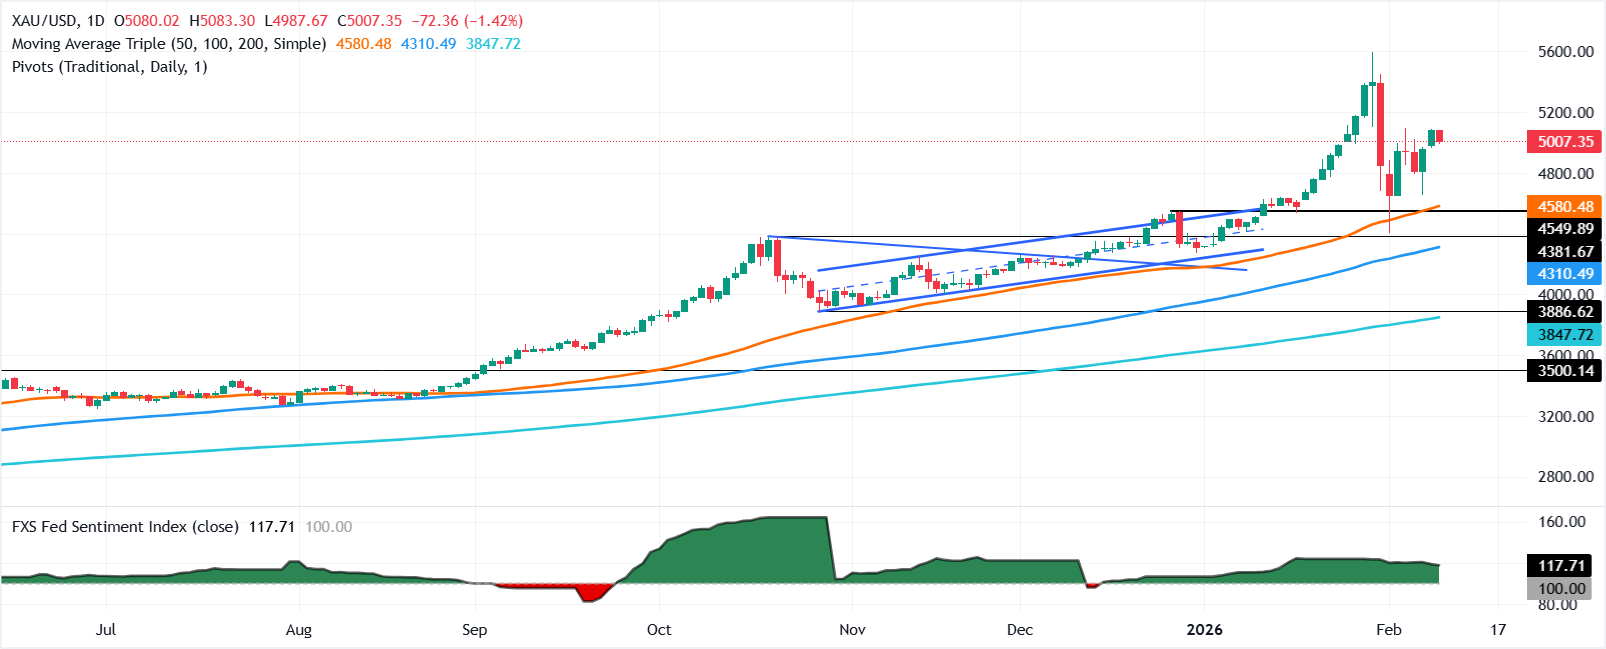
Gold price continues to trade within the $5,000-$5,100 mark as traders remained unable to clear the top/bottom of the range, waiting for a fresh catalyst. Momentum as measured by the Relative Strength Index (RSI), although bullish, is aiming toward its neutral level. This indicates that sellers are capping Bullion’s advance.
If Gold rises past $5,100, this opens the door for higher prices, like $5,200, followed by the January 30 peak at $5,451 and the record high near $5,600. On the downside, a move below $5,000 opens the door to test the 20-day Simple Moving Average (SMA) at $4,910, followed by $4,800 and ahead of the February 2 low at $4,402.
Gold FAQs
Gold has played a key role in human’s history as it has been widely used as a store of value and medium of exchange. Currently, apart from its shine and usage for jewelry, the precious metal is widely seen as a safe-haven asset, meaning that it is considered a good investment during turbulent times. Gold is also widely seen as a hedge against inflation and against depreciating currencies as it doesn’t rely on any specific issuer or government.
Central banks are the biggest Gold holders. In their aim to support their currencies in turbulent times, central banks tend to diversify their reserves and buy Gold to improve the perceived strength of the economy and the currency. High Gold reserves can be a source of trust for a country’s solvency. Central banks added 1,136 tonnes of Gold worth around $70 billion to their reserves in 2022, according to data from the World Gold Council. This is the highest yearly purchase since records began. Central banks from emerging economies such as China, India and Turkey are quickly increasing their Gold reserves.
Gold has an inverse correlation with the US Dollar and US Treasuries, which are both major reserve and safe-haven assets. When the Dollar depreciates, Gold tends to rise, enabling investors and central banks to diversify their assets in turbulent times. Gold is also inversely correlated with risk assets. A rally in the stock market tends to weaken Gold price, while sell-offs in riskier markets tend to favor the precious metal.
The price can move due to a wide range of factors. Geopolitical instability or fears of a deep recession can quickly make Gold price escalate due to its safe-haven status. As a yield-less asset, Gold tends to rise with lower interest rates, while higher cost of money usually weighs down on the yellow metal. Still, most moves depend on how the US Dollar (USD) behaves as the asset is priced in dollars (XAU/USD). A strong Dollar tends to keep the price of Gold controlled, whereas a weaker Dollar is likely to push Gold prices up.
Author

Christian Borjon Valencia
FXStreet
Markets analyst, news editor, and trading instructor with over 14 years of experience across FX, commodities, US equity indices, and global macro markets.


