Making sense of the market's tech worries

Key takeaways
- Recent weakness in AI stocks has been at the forefront of concerns.
- The absence of economic data has added fuel to the worries.
- Just NVIDIA remains to report from the Mag 7 group.
The recent pullback in leading artificial intelligence stocks has rekindled concerns about the group’s stock price momentum and market leadership. The absence of economic data due to the government shutdown, at a time of economic vulnerabilities, is adding to market angst.
Valuation concerns typically take a back seat during periods of market exuberance, but take center stage when the outlook is murky. Valuation levels are unhelpful, whether we are looking at the Mag 7 group or the market as a whole.
The chart below shows the forward 12-month P/E for the Zacks proxy for the Mag 7 group and the S&P 500 index over the last 10 years.
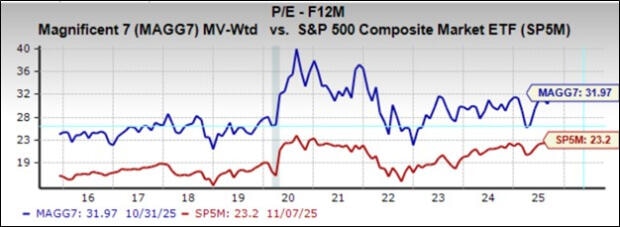
Image Source: Zacks Investment Research
Relative to the market as a whole, the Mag 7 group is trading at a 36% premium at present. Over the last 10 years, the group’s valuation premium to the market has been as high as 72%, as low as 24%, with the median at 45%.
As you can see here, while the absolute valuation levels are at or near record levels, they don’t appear unusually stretched in relative terms, particularly if you aren’t sympathetic to the ‘AI bubble’ narrative.
What we are saying here is that pullbacks along the lines of what we are seeing in recent days need not be catastrophized; they are part of a healthy and dynamic marketplace. Even after the group’s recent weakness, Mag 7 stocks are up +17.9% this year vs. the market’s +16% gain. The group is up +23.1% over the past year vs. a +14.1% gain for the S&P 500 index.
It is reasonable to be skeptical of the value of Meta’s (META - Free Report) AI investments or the lofty pronouncements from OpenAI about new relationships, whether on the infrastructure side with chipmakers or the long-term tie-ins with leading hyperscalers.
A notable contributing factor in establishing the Mag 7 group’s leadership status is the group’s enormous earnings power and impressive growth profile. For Q3, the group’s earnings are on track to be up +26.7% from the same period last year on +17.6% higher revenues, which would follow the group’s +26.4% earnings growth on +15.5% revenue growth in the preceding period (2025 Q2).
Not all members of the elite group are equally contributing to the growth pace, ranging from Tesla’s (TSLA - Free Report) -39.5% earnings decline in Q3 to Alphabet’s (GOOGL - Free Report) +33% jump.
The chart below shows the group’s blended Q3 earnings and revenue growth relative to the preceding period and the expected growth over the next three periods.
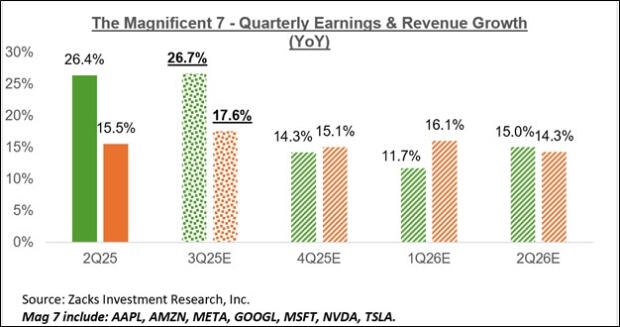
Image Source: Zacks Investment Research
Estimates for the current period (2025 Q4) are going up, with the current earnings growth rate of +14.3% up from +12.2% a week ago.
Market participants appear to have found their peace with these companies’ ever-rising capex plans, particularly if management teams can show some tangible gain in their results. We saw that with Amazon (AMZN - Free Report) and Alphabet, with both showing accelerating gains in their respective cloud businesses.
Microsoft reported strong cloud revenue growth of +26% from the same period last year, a modest downtick from the preceding period’s +27% growth pace, with the December-quarter guidance indicating further deceleration. Despite this deceleration in cloud revenues, management indicated an accelerating capex spending trend in fiscal year 2026. The increased capex is expected to address the capacity issue that has been the primary driver of decelerating cloud revenue growth at Microsoft.
Unlike Amazon, Microsoft, and Alphabet, Meta can’t point to a specific business unit whose revenues are accelerating due to the spending growth. Market participants were disappointed with management’s raised guidance for 2026 capex and operating expenses, coupled with almost in-line revenue guidance for the December quarter.
The chart below shows the performance of Microsoft (down -4.9%), Meta (down -15.2%), Amazon (up +7.3%), and Alphabet (up +15.5%) relative to the S&P 500 index (up +0.5%).
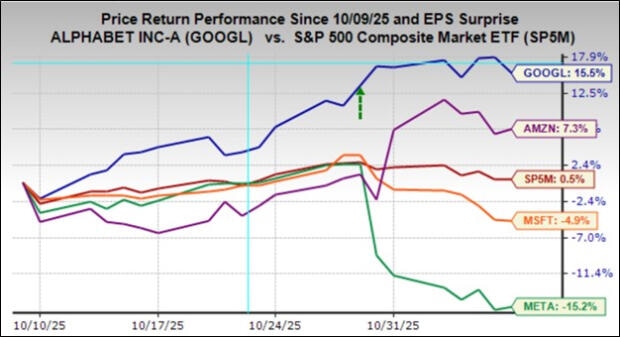
Image Source: Zacks Investment Research
The chart below shows the Mag 7 group’s earnings and revenue growth picture on an annual basis.
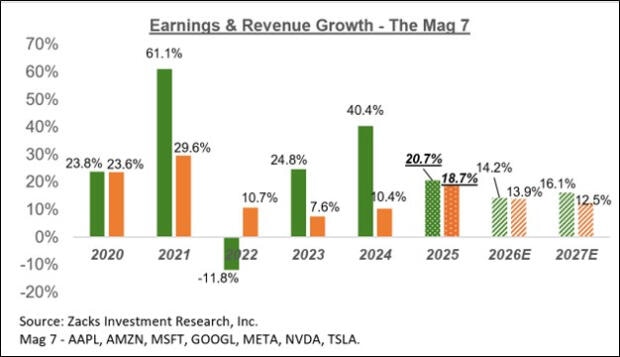
Image Source: Zacks Investment Research
Please note that the Mag 7 group is on track to bring in 25.3% of all S&P 500 earnings in 2025, up from 23.2% of the total in 2024 and 18.3% in 2023. Regarding market capitalization, the Mag 7 group currently accounts for 34.9% of the index. If this group of mega-cap companies was a stand-alone sector, it would be the second-biggest in the S&P 500 index, just behind the Technology sector at 43.7% and above the Finance sector at 12.9%.
Q3 earnings season scorecard
Including all reports released through Friday, November 7th, we now have Q3 results from 451 S&P 500 members, or 90.6% of the index’s total membership. Total earnings for these companies are up +14.6% from the same period last year on +8.2% higher revenues, with 82.7% beating EPS estimates and 76.1% beating revenue estimates.
The comparison charts below place the Q3 earnings and revenue growth rates of these companies in historical context.
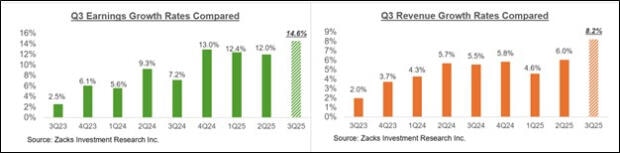
Image Source: Zacks Investment Research
The comparison charts below show the Q3 EPS and revenue beats percentages in a historical context.
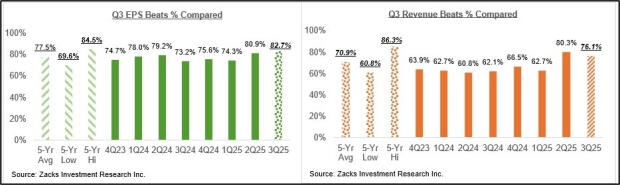
Image Source: Zacks Investment Research
For the Tech sector, we now have Q3 results for 70.3% of the sector’s market capitalization in the S&P 500 index. Total earnings for these Tech companies are up +24.4% from the same period last year on +12.6% higher revenues, with 87.9% beating EPS estimates and 86.4% beating revenue estimates.
The comparison charts below show the sector’s Q3 EPS and revenue beats percentages in a historical context.
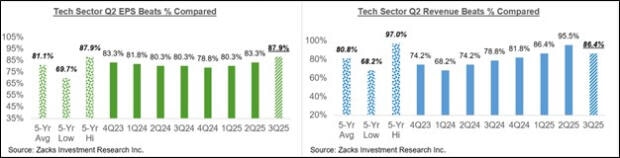
Image Source: Zacks Investment Research
The comparison charts below show the sector’s Q3 earnings and revenue growth rates in a historical context.
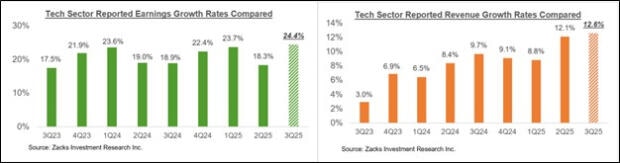
Image Source: Zacks Investment Research
The earnings big picture
The chart below shows current Q3 earnings and revenue growth expectations for the S&P 500 index in the context of the preceding 4 quarters and the coming four quarters.
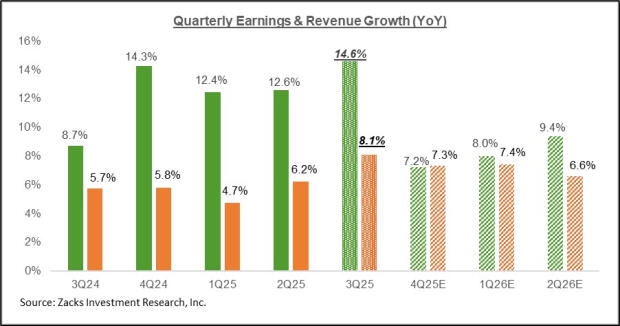
Image Source: Zacks Investment Research
Please note that the +14.6% earnings growth rate for Q3 shown above represents the blended growth rate for the quarter, which combines the actual results for the 451 companies that have reported with estimates for the companies still to report.
The chart below shows the overall earnings picture on a calendar-year basis.
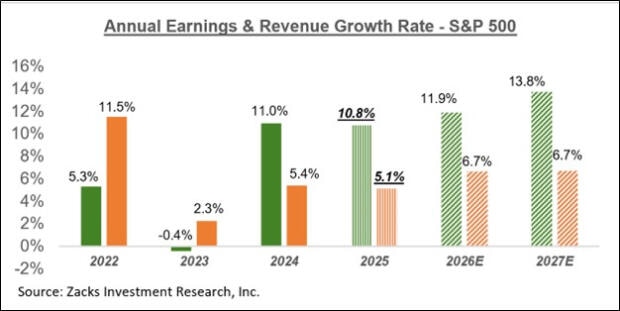
Image Source: Zacks Investment Research
In terms of S&P 500 index ‘EPS’, these growth rates approximate to $260.83 for 2025 and $291.90 for 2026.
Want the latest recommendations from Zacks Investment Research? Download 7 Best Stocks for the Next 30 Days. Click to get this free report
Want the latest recommendations from Zacks Investment Research? Download 7 Best Stocks for the Next 30 Days. Click to get this free report
Author

Zacks
Zacks Investment Research
Zacks Investment Research provides unbiased investment research and tools to help individuals and institutional investors make confident investing decisions.


