Lululemon Athletica Inc. (LULU) Elliott Wave technical analysis [Video]
![Lululemon Athletica Inc. (LULU) Elliott Wave technical analysis [Video]](https://editorial.fxstreet.com/images/Markets/Equities/shares-certificate-7851553_XtraLarge.jpg)
LULU Elliott Wave technical analysis
Function: Trend.
Mode: Impulsive.
Structure: Motive.
Position: Wave (1).
Direction: Upside in (1).
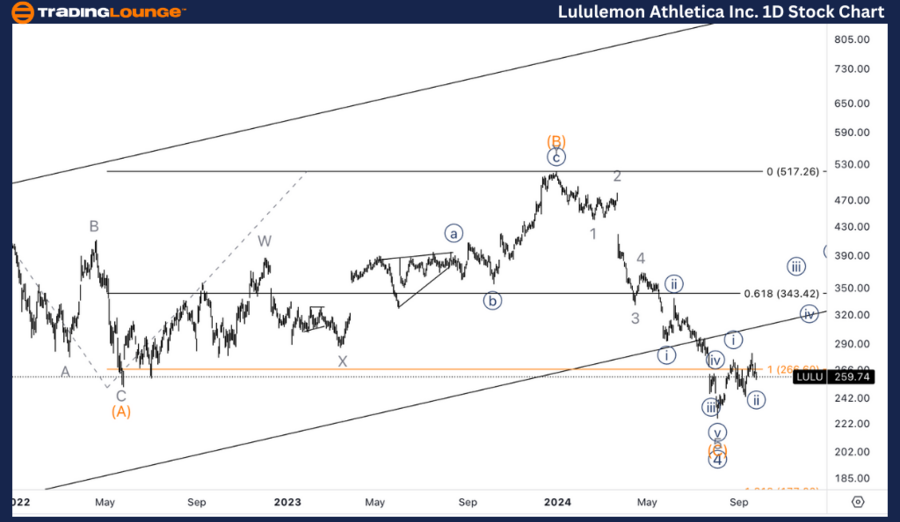
Details: We are looking at the possibility of a bottom in place in Primary wave 4, to now resume higher, as we found support on top of TL2 at 200$.
LULU Elliott Wave technical analysis – Daily chart
On the daily chart, Lululemon is progressing in Wave (1) of a new impulsive upward trend, following what appears to be the completion of Primary Wave 4. The stock has found support around $200, near Trading Level 2 (TL2), which indicates a likely bottom has formed.
With this support in place, the expectation is for a continuation of the upside as Wave (1) progresses, marking the beginning of a new bullish cycle. Traders can look for confirmation of this trend resumption as the price pushes higher above key resistance levels.
LULU Elliott Wave technical analysis
Function: Trend.
Mode: Impulsive.
Structure: Motive.
Position: Wave 1.
Direction: Bottom in wave {ii} of 1.
Details: Looking for the completion of a three wave move into wave {ii} to then resume higher. As the initial move down from the wave {i} top appears to be a three wave move, we could expect at least another leg higher.
LULU Elliott Wave technical analysis – One-hour chart
On the 1-hour chart, Lululemon is within Wave 1 of the larger daily structure, and we are currently observing a correction in Wave {ii}. The move down from the Wave {i} top appears to be a three - wave corrective structure, which suggests that Wave {ii} is nearing completion.
Once this correction ends, the expectation is for the stock to resume its upward trajectory, likely signaling the start of Wave {iii}. Given the corrective nature of the decline, the next leg higher could provide a strong bullish impulse.
.png.c3cfc3d46f5136249dec4a452a633134.png)
This Elliott Wave analysis for Lululemon Athletica Inc. (LULU) evaluates the current trend structure and provides insights into potential future movements based on wave positioning. We will examine both the daily and 1-hour charts to gauge the stock’s outlook.
Lululemon Athletica Inc. (LULU) Elliott Wave technical analysis [Video]
Author

Peter Mathers
TradingLounge
Peter Mathers started actively trading in 1982. He began his career at Hoei and Shoin, a Japanese futures trading company.


