|

Lennox International (LII) Elliott Wave analysis  —  Correction ahead before the next rally

LII stock enters a wave IV corrective phase, offering potential buying opportunities before a strong bullish wave V rally resumes.

Lennox International (LII) has been in a strong uptrend for many years, following a clear Elliott Wave impulsive structure. The stock recently completed wave III on the monthly chart and is now entering a corrective phase marked as wave IV. This pullback is a healthy part of the overall bullish cycle and offers opportunities for long-term investors.

Expected Elliott Wave structure

The ongoing correction is likely to unfold as a three-wave structure, which is highly probable due to the principle of alternation, given that Wave II was a flat correction.. The first leg, wave ((A)), is expected to drive prices lower in the short term. After that, a wave ((B)) recovery may follow before wave ((C)) completes the correction. Once wave IV ends, wave V is expected to begin, likely pushing prices to new highs. This upcoming rally could offer strong potential for long-term investors.

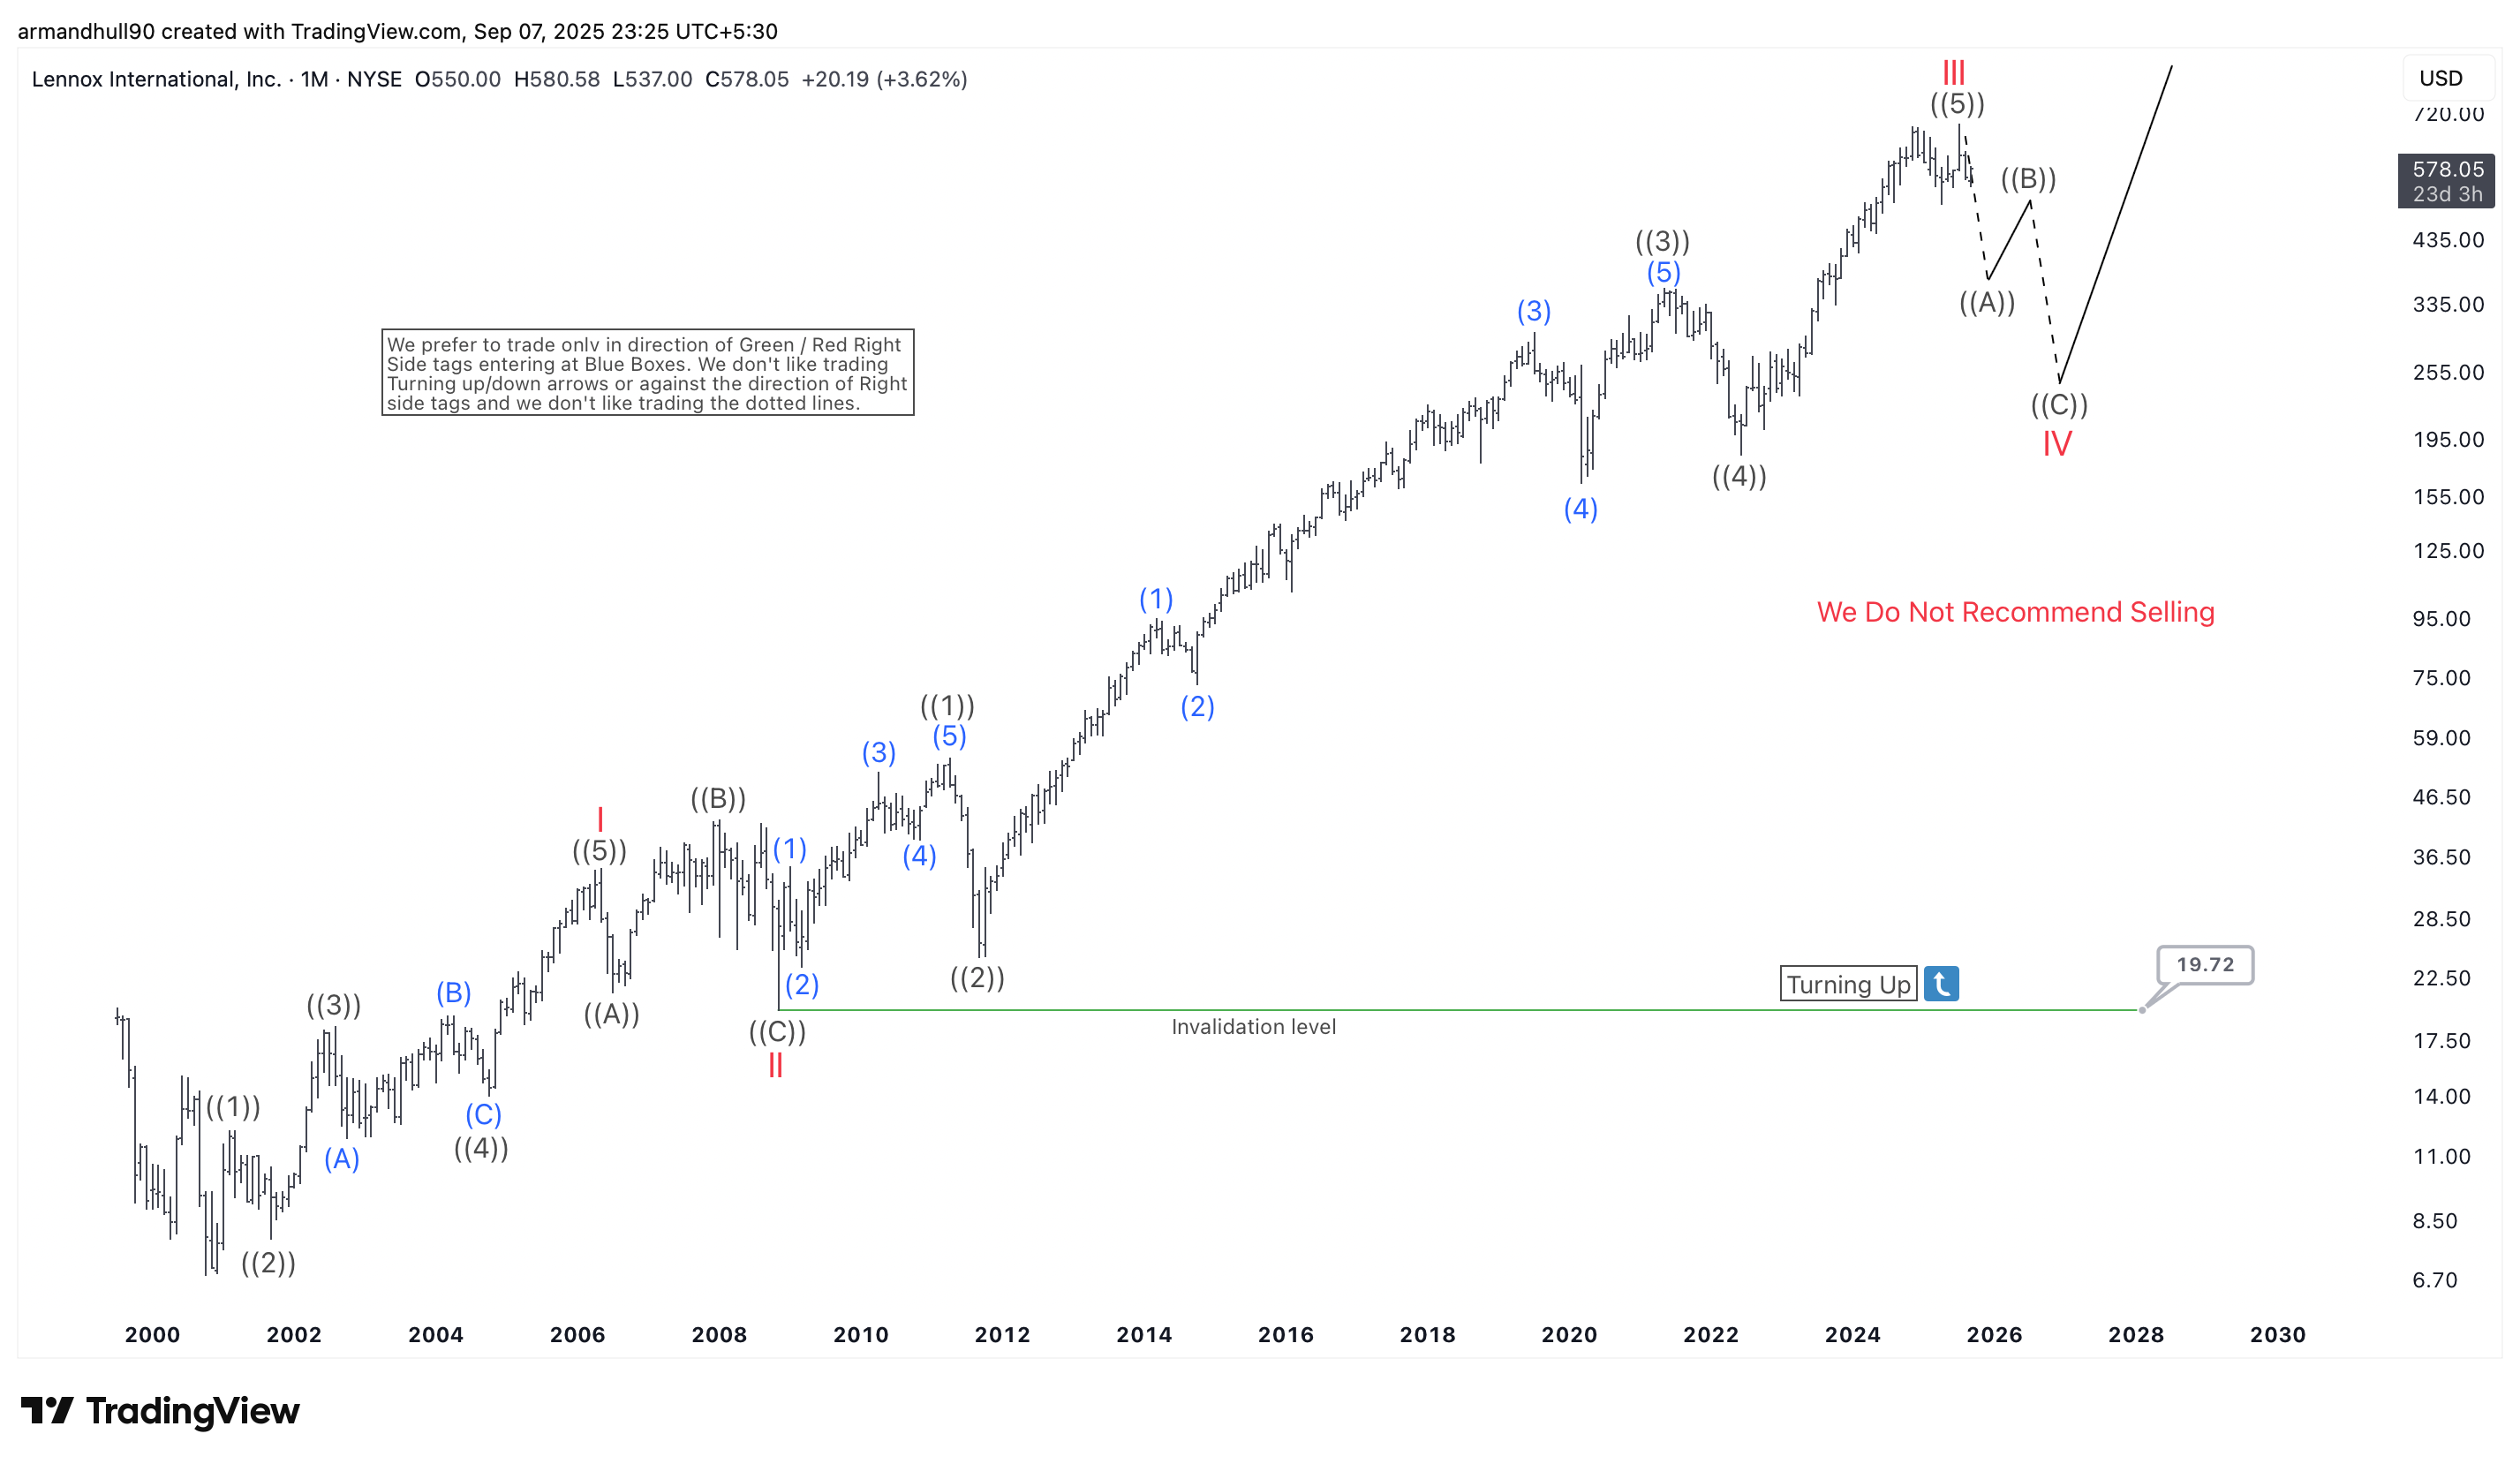
At present, LII is trading near $578 and showing early signs of weakness as the correction begins. However, the broader uptrend remains intact as long as prices stay above the invalidation level at $19.72. Traders should avoid aggressive selling during this phase and instead prepare to enter when wave IV nears completion. Watching Fibonacci retracement zones and blue box buying areas can help identify possible reversal levels.

Final outlook

LII remains in a larger bullish cycle despite the ongoing corrective phase. Patience will be key, as a deeper pullback in wave IV can create attractive entry setups before the next rally in wave V begins.

Author

Elliott Wave Forecast Team

Elliott Wave Forecast Team

ElliottWave-Forecast.com

More from Elliott Wave Forecast Team
Share:

Markets move fast. We move first.

Orange Juice Newsletter brings you expert driven insights - not headlines. Every day on your inbox.

By subscribing you agree to our Terms and conditions.

Editor's Picks

EUR/USD eyes 1.1800 barrier near two-month highs

EUR/USD extends its gains for the second successive session, trading around 1.1780 during the Asian hours on Tuesday. On the daily chart, technical analysis indicates a persistent bullish bias, as the pair moves upward within the ascending channel pattern. Additionally, the 14-day Relative Strength Index at 68.89 sits near overbought, signaling strong demand. RSI remains elevated, which could cap gains if overbought conditions emerge.

GBP/USD knocks ten-week highs ahead of holiday slowdown

GBP/USD found room on the high side on Monday, kicking off a holiday-shortened trading week with a fresh spat of Greenback weakness, bolstering the Pound Sterling into its highest bids in ten weeks. Pound traders are largely brushing off the latest interest rate cut from the Bank of England as the UK’s central bank policy strategy leaves the water murky for rate-cut watchers.

Gold bulls seem unstoppable amid supportive fundamental backdrop

Gold is seen building on the previous day's strong rally of over 2% and continues scaling new all-time highs for the second consecutive day on Tuesday. The commodity climbs closer to the $4,500 psychological mark during the Asian session and remains well supported by a combination of factors. 

Uniswap holds above $6 as traders eye UNIfication vote outcome

Uniswap price holds above $6 at the time of writing on Tuesday after closing above a key resistance zone in the previous week. Traders are focusing on the highly anticipated UNIfication proposal, which is set to conclude on Thursday, and could become a key near-term catalyst. On the technical side, momentum indicators are flashing bullish signals, hinting at an upside rally.

Ten questions that matter going into 2026

2026 may be less about a neat “base case” and more about a regime shift—the market can reprice what matters most (growth, inflation, fiscal, geopolitics, concentration). The biggest trap is false comfort: the same trades can look defensive… right up until they become crowded.

XRP steadies above $1.90 support as fund inflows and retail demand rise

Ripple (XRP) is stable above support at $1.90 at the time of writing on Monday, after several attempts to break above the $2.00 hurdle failed to materialize last week. Meanwhile, institutional interest in the cross-border remittance token has remained steady.