KOSPI Composite Index Elliott Wave technical analysis [Video]
![KOSPI Composite Index Elliott Wave technical analysis [Video]](https://editorial.fxsstatic.com/images/i/General-Stocks_1_XtraLarge.png)
KOSPI Composite Elliott Wave technical analysis
-
Function: Bullish Trend.
-
Mode: Impulsive.
-
Structure: Orange Wave 3.
-
Position: Navy Blue Wave 1.
-
Next lower degree direction: Orange Wave 4.
-
Wave cancellation invalid level: 2,438.17.
Analysis overview
The KOSPI Composite Elliott Wave Analysis for the day chart highlights a bullish trend, with the market currently in an impulsive mode. The structure is identified as Orange Wave 3, forming part of a larger upward movement within Navy Blue Wave 1. This indicates a strong uptrend, characteristic of an impulsive wave structure.
The next expected movement is Orange Wave 4, which is likely to follow the completion of Orange Wave 3.
Key insights
-
Wave 2 Completion: Orange Wave 2 appears to have ended, confirming the transition to Orange Wave 3.
-
Wave 3 Momentum: Orange Wave 3 is expected to exhibit strong bullish movement, consistent with an impulsive wave.
-
Potential Corrective Phase: Once Wave 3 concludes, Orange Wave 4 may introduce a corrective phase, bringing temporary pullbacks or consolidation before the uptrend resumes.
Critical level to watch
-
Wave Cancellation Invalid Level: 2,438.17.
-
If the price falls below 2,438.17, the current wave count becomes invalid, requiring a market reassessment.
-
This level acts as key support, and a breach could indicate a trend shift or structural change.
Conclusion
The KOSPI Composite remains in a bullish trend, with Orange Wave 3 actively unfolding after the completion of Orange Wave 2. The next anticipated movement is Orange Wave 4, which may introduce a corrective phase before the trend continues.
Traders should closely monitor the price action around the 2,438.17 level, as it serves as a key threshold for validating the current wave count and maintaining the bullish outlook. Understanding wave structures is essential to anticipate market movements and optimize trading strategies accordingly.
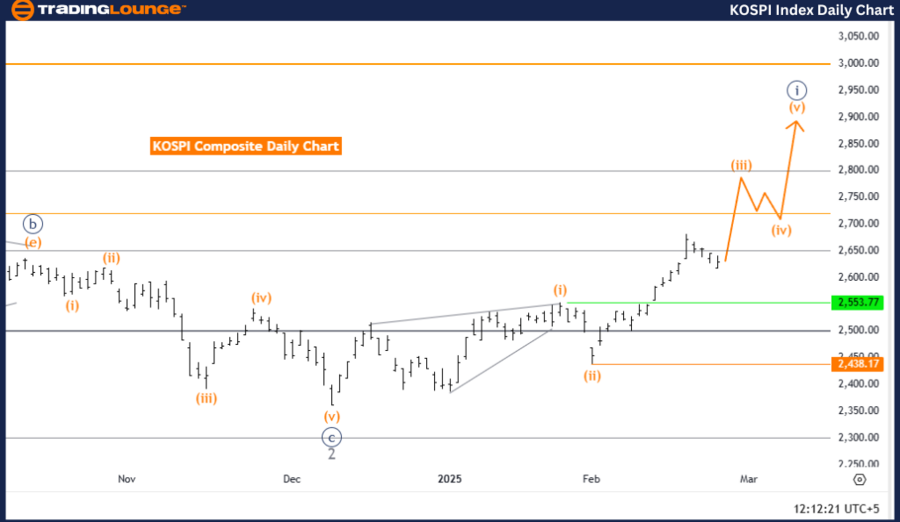
Day chart
KOSPI Composite Elliott Wave technical analysis
-
Function: Bullish Trend.
-
Mode: Impulsive.
-
Structure: Orange Wave 3.
-
Position: Navy Blue Wave 1.
-
Next lower degree direction: Orange Wave 4.
-
Wave cancellation invalid level: 2,438.17.
Analysis overview
The KOSPI Composite Elliott Wave Analysis for the weekly chart highlights a bullish trend, with the market currently in an impulsive mode. The structure is identified as Orange Wave 3, which is part of a larger upward movement within Navy Blue Wave 1. This suggests that the market is in a strong uptrend, consistent with the characteristics of an impulsive wave structure.
The next expected movement is Orange Wave 4, which is likely to follow the completion of Orange Wave 3.
Key insights
- Wave 2 Completion: Orange Wave 2 has likely ended, signaling the transition to Orange Wave 3.
- Wave 3 Momentum: Orange Wave 3 is expected to exhibit strong bullish movement, in line with an impulsive wave.
- Potential Corrective Phase: Once Wave 3 concludes, Orange Wave 4 may introduce a corrective phase, leading to temporary pullbacks or consolidation before the trend resumes.
Critical level to watch
- Wave Cancellation Invalid Level: 2,438.17
- If the price falls below 2,438.17, the current wave count becomes invalid, requiring a market reassessment.
- This level serves as key support, and a breach could indicate a trend shift or structural change.
Conclusion
The KOSPI Composite remains in a bullish trend, with Orange Wave 3 actively unfolding after the completion of Orange Wave 2. The next anticipated movement is Orange Wave 4, which may introduce a corrective phase before the trend continues.
Traders should closely monitor the price action around the 2,438.17 level, as it serves as a key threshold for validating the current wave count and maintaining the bullish outlook. Understanding wave structures is essential to anticipate market movements and optimize trading strategies accordingly.

Weekly chart
KOSPI Composite Index Elliott Wave technical analysis [Video]
Author

Peter Mathers
TradingLounge
Peter Mathers started actively trading in 1982. He began his career at Hoei and Shoin, a Japanese futures trading company.


