|

Kohl’s Corporation (KSS) found a technical macro bottom

Kohl’s stock trades on NYSE under ticker KSS and has been public since 1992, showing growth and fluctuations.

Kohl’s Corporation operates over 1,100 US department stores and is based in Wisconsin. The company was founded in 1962 and faces growing competition from online retailers. It’s adapting to the changing retail landscape by expanding online presence and partnering with Amazon for  returns.

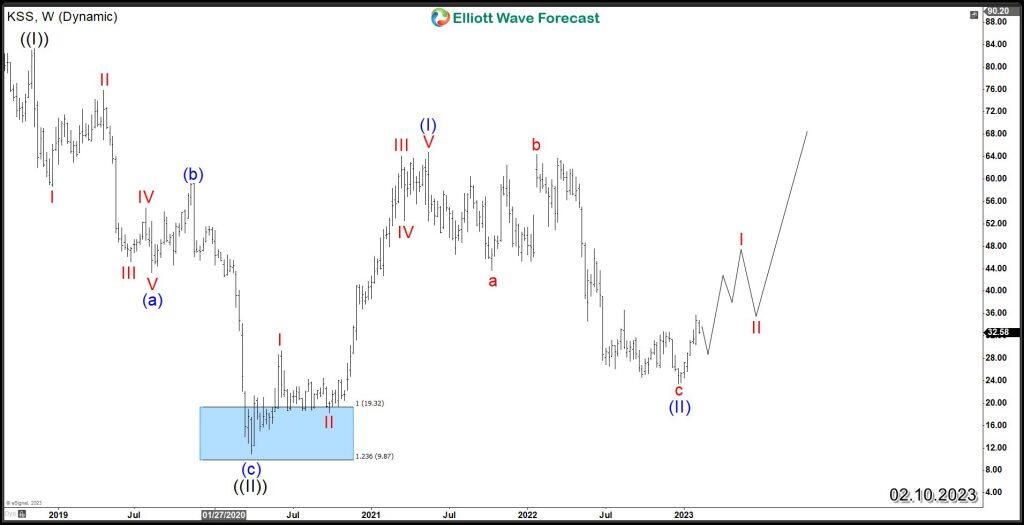
Despite these efforts, Kohl’s stock has underperformed compared to the overall market in recent years specifically since it’s peak in 2018. As we can see in the weekly chart of KSS, the stock suffered a significant decline 86% from it’s 2018 peak wave ((I)) which was a technical corrective Elliott Wave zigzag structure (a)(b)(c) finding major support at equal legs area ( blue box ) 19.32 – 9.87 in April 2020 to end wave ((II)).

Since then, KSS managed to establish an Impulsive 5 waves advance in wave (I) followed by another 3 waves correction in wave (II) ending in December of last year. Based on these structure, we can understand that weekly declines were corrective structures. The stock curved a Macro bottom in the recent years preparing it for the next weekly rally and it’s expected to take it to new all time highs.

Kohl’s corporation KSS Elliott Wave weekly chart

KSS

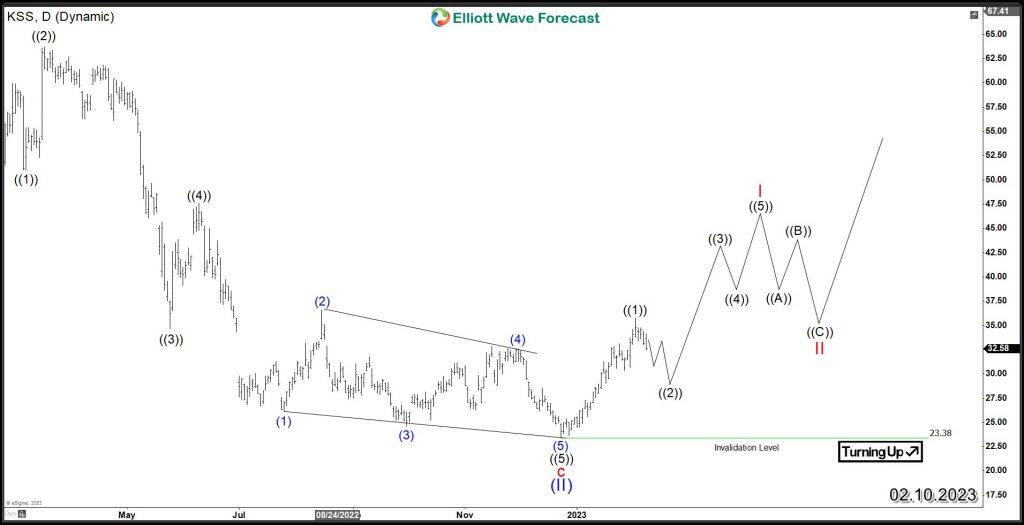
Coming from December 2022 low 23.38, KSS rallied within an impulsive structure wave ((1)). The move suggested that correction has ended and a new cycle has started. Consequently, the stock can establish a new rally to the upside as long as the next pullback of wave ((2)) remains above that low to create the rest of the impulse in wave (I).

Kohl’s corporation KSS Elliott Wave daily chart

KSS

Kohl’s may offer long-term growth for investors. It has a stable financial performance, with revenue around $19B and modest net income. Kohl’s underperformed in recent years but has adapted to the retail landscape changes, which is reflected in its stock performance based on the Elliott Wave structure.

Author

Elliott Wave Forecast Team

Elliott Wave Forecast Team

ElliottWave-Forecast.com

More from Elliott Wave Forecast Team
Share:

Markets move fast. We move first.

Orange Juice Newsletter brings you expert driven insights - not headlines. Every day on your inbox.

By subscribing you agree to our Terms and conditions.

Editor's Picks

EUR/USD posts modest gains above 1.1700 as ECB signals pause

The EUR/USD pair posts modest gains around 1.1710 during the early Asian session on Monday. The Euro strengthens against the Greenback after the European Central Bank left its policy rates unchanged and took a more positive view on the Eurozone economy, which has shown resilience to global trade shocks. Financial markets are likely to remain subdued as traders book profits ahead of the long holiday period.

GBP/USD steadies below 1.3400 as traders assess BoE policy outlook

Following Thursday's volatile session, GBP/USD moves sideways below 1.3400 on Friday. Investors reassess the Bank of England's policy oıtlook after the MPC decided to cut the interest rate by 25 bps by a slim margin. Meanwhile, the improving risk mood helps the pair hold its ground.

Gold: 2026 could see new record-highs but a 2025-like rally is unlikely

Gold started the year on a bullish note and registered impressive gains in the first quarter. Following a consolidation phase during the summer months, the precious metal surged higher in the third quarter and reached an all-time record high of $4,381 in October. Although XAU/USD corrected lower, buyers refused to hand over the reins heading into the holiday season.

Week ahead: Key risks to watch in last days of 2025 and early 2026

The festive period officially starts next week, with many traders vacating their desks until the first full week of January, making way for thin trading volumes and very few top-tier releases.

How much can one month of soft inflation change the Fed’s mind?

One month of softer inflation data is rarely enough to shift Federal Reserve policy on its own, but in a market highly sensitive to every data point, even a single reading can reshape expectations. November’s inflation report offered a welcome sign of cooling price pressures. 

XRP rebounds amid ETF inflows and declining retail demand demand

XRP rebounds as bulls target a short-term breakout above $2.00 on Friday. XRP ETFs record the highest inflow since December 8, signaling growing institutional appetite.