JSW Steel Indian stocks Elliott Wave technical analysis [Video]
![JSW Steel Indian stocks Elliott Wave technical analysis [Video]](https://editorial.fxsstatic.com/images/i/stock-01.jpg)
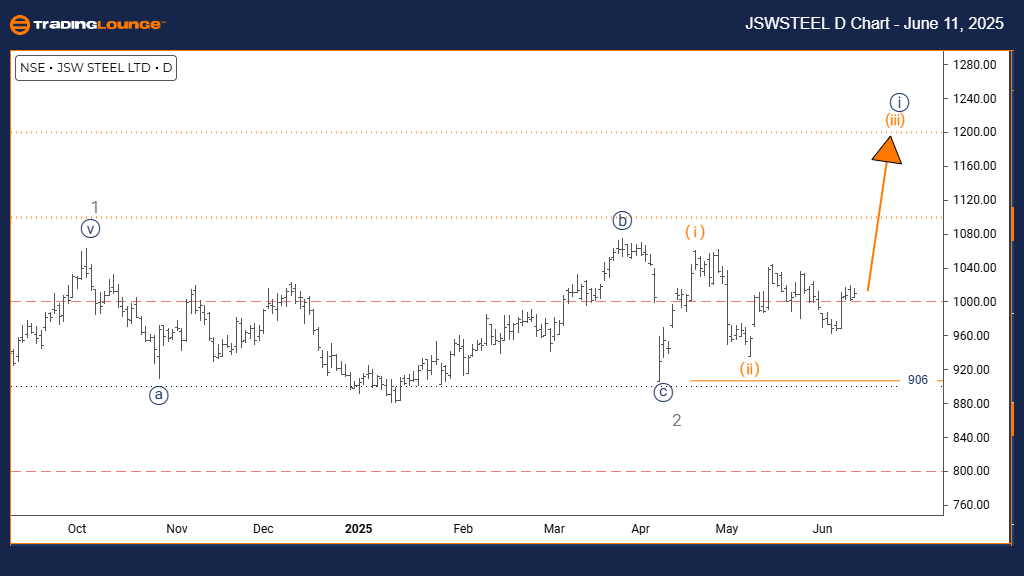
JSW Steel Elliott Wave analysis – Day chart
-
Function: Bullish Trend.
-
Mode: Impulsive.
-
Structure: Orange Wave 3.
-
Position: Navy Blue Wave 1.
-
Direction next higher degrees: Orange Wave 3 (Active).
-
Details: Orange Wave 2 appears completed, with Orange Wave 3 now unfolding.
-
Wave cancel invalid level: 906.
The JSW STEEL daily chart Elliott Wave analysis highlights a bullish trend. Price action is currently in an impulsive mode, signaling strong upward momentum. The active wave structure is identified as Orange Wave 3, which is part of a broader bullish move defined by Navy Blue Wave 1. This setup indicates a robust upward phase within a long-term rally.
The chart suggests that Orange Wave 2 has likely completed its corrective pattern, setting the stage for the more dynamic Orange Wave 3. This wave is typically the strongest in the Elliott Wave sequence and is often associated with sharp upward price movements. The next wave to observe in the higher degree is Orange Wave 3, now in progress based on the current wave structure.
A key level to watch is the invalidation threshold at 906. If the price falls below this level, the existing bullish interpretation would be nullified and require reevaluation. Until such a break occurs, the current wave structure remains supportive of further upside movement. The impulsive character of Orange Wave 3 reflects growing buying interest and the potential for meaningful gains ahead. Traders should monitor developments relative to the 906 level while anticipating continued progress within the broader Navy Blue Wave 1 trend.
JSW Steel Elliott Wave analysis – Weekly chart
-
Function: Bullish Trend.
-
Mode: Impulsive.
-
Structure: Navy Blue Wave 1.
-
Position: Gray Wave 3.
-
Direction next lower degrees: Navy Blue Wave 2.
-
Details: Gray Wave 2 appears completed, and Navy Blue Wave 1 of Gray Wave 3 is now active.
-
Wave cancel invalid level: 906.
The JSW STEEL weekly chart Elliott Wave analysis outlines a strong bullish trend, with price action currently in impulsive mode. The ongoing wave structure is classified as Navy Blue Wave 1, which is part of a larger Gray Wave 3 formation. This position implies that the stock is entering an early but significant stage of an extended upward trend.
According to the analysis, Gray Wave 2 seems to have finished its corrective movement, marking the start of Navy Blue Wave 1 within Gray Wave 3. This transition typically initiates a powerful upward impulsive phase. The next movement expected on a lower degree is Navy Blue Wave 2, a corrective wave that generally follows Wave 1 before the broader trend resumes.
The wave invalidation level is marked at 906. A price move below this point would nullify the current wave count and require a revised analysis. Until that level is breached, the existing bullish structure remains intact, supporting the potential for further upside. With Gray Wave 3 in progress and Navy Blue Wave 1 currently in play, the setup reflects growing market optimism. Traders should watch price movements closely relative to 906 to validate the wave count and anticipate the next move in the trend.
JSW Steel Indian stocks Elliott Wave technical analysis [Video]
Author

Peter Mathers
TradingLounge
Peter Mathers started actively trading in 1982. He began his career at Hoei and Shoin, a Japanese futures trading company.


