|

JPM Elliott Wave technical analysis [Video]

JPM Elliott Wave Analysis Trading Lounge.

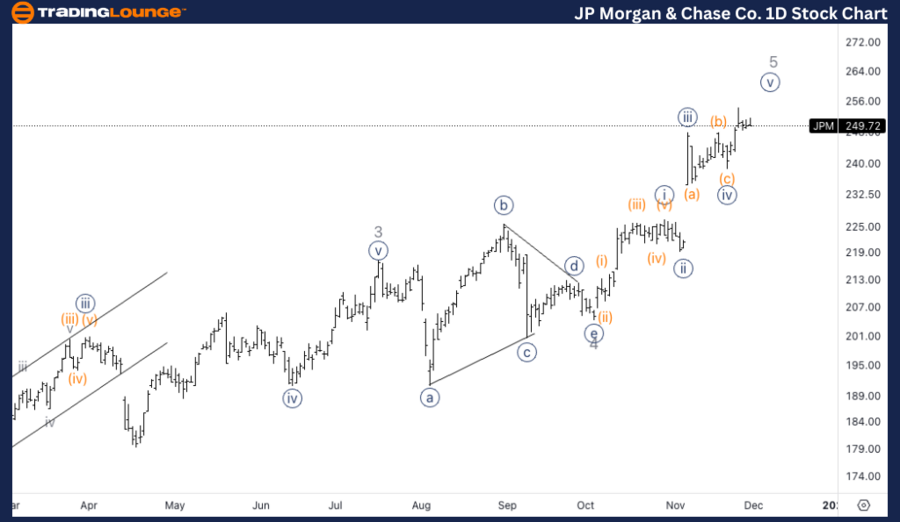
JP Morgan & Chase Co., (JPM) Daily Chart.

JPM Elliott Wave Technical Analysis

Function: Trend.

Mode: Impulsive.

Structure: Motive.

Position: Minor wave 5.

Direction: Upside in 3 of (5).

Details: Looking for upside into wave 5. The conservative view suggests we could have a top in place in wave 5 at 250$. It’s possible we will see an extension in wave {v} towards TradingLEvel3 at 300$.

Chart

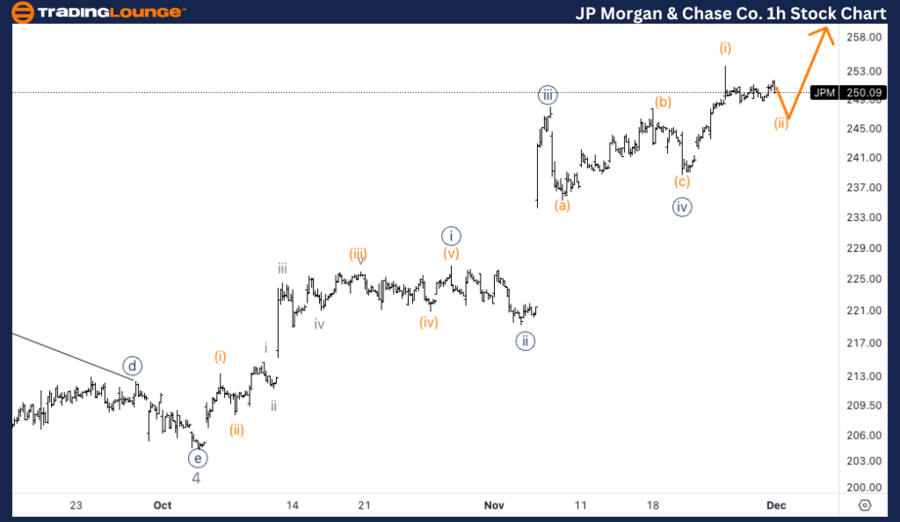
JP Morgan & Chase Co., (JPM) 1H Chart.

JPM Elliott Wave technical analysis

Function: Trend.

Mode: Impulsive.

Structure: Motive.

Position: Wave (ii) of {v}.

Direction: Upside into wave (iii).

Details: Looking for completion in wave (ii) with another leg lower to then resume higher towards wave (iii) of {v}.

Chart

This Elliott Wave analysis for JP Morgan & Chase Co., (JPM) examines both the daily and 1-hour charts to assess its current market trend, utilizing Elliott Wave Theory to anticipate potential future movements.

JPM Elliott Wave technical analysis – Daily chart

JPM is in the process of advancing within wave 5 of (5). While there is a possibility that wave 5 could have already topped near $250, a more bullish scenario suggests an extension of wave {v}. If this happens, the price could rally toward TradingLevel3 at $300. The longer-term view supports continued upside, but caution is warranted around the $250 level.

JPM Elliott Wave technical analysis – One-hour chart

On the 1-hour chart, JPM is completing wave (ii) of {v} and is expected to make another leg lower to finish this corrective move. Once wave (ii) completes, the stock is anticipated to resume higher, entering wave (iii) of {v}, targeting a move above $250 in line with the longer-term outlook.

Technical analyst: Alessio Barretta.

JPM Elliott Wave technical analysis [Video]

Author

Peter Mathers

Peter Mathers

TradingLounge

Peter Mathers started actively trading in 1982. He began his career at Hoei and Shoin, a Japanese futures trading company.

More from Peter Mathers
Share:

Editor's Picks

EUR/USD holds losses below 1.1900 despite bullish bias

EUR/USD edges lower after three days of gains, trading around 1.1870 during the Asian hours on Tuesday. The technical analysis of the daily chart shows that the pair rises within the ascending channel pattern, suggesting an ongoing bullish bias.

GBP/USD gains ground above 1.3650, overbought RSI signals potential pause

The GBP/USD pair extends the rally to near 1.3685, the highest since September 17, 2025, during the early European session on Tuesday. The Pound Sterling edges higher against the US Dollar on the stronger-than-expected UK Retail Sales and Purchasing Managers’ Index data. These upbeat reports have led some analysts to predict a potential delay in further Bank of England rate cuts. 

Gold remains close to all-time peak amid safe-haven flows, weak USD, ahead of Fed

Gold attracts fresh buyers following the previous day's late pullback from levels beyond the $5,100 mark, or the all-time high, and sticks to the positive bias for the seventh straight day on Tuesday. The US Dollar struggles to gain any positive traction or register any meaningful recovery from its lowest level since September 2025, touched on Monday, amid concerns over US President Donald Trump’s trade policies. 

Axie Infinity rallies as bAXS token reveal boosts retail demand

Axie Infinity is up 3% at press time on Tuesday, extending the 21% gains from Monday and a bullish start to the week. The gaming token regains retail demand following the announcement of its app token, bAXS, to replace the AXS token across the ecosystem and gameplay rewards. This surge in retail demand pumps the AXS futures Open Interest to a three-year high. 

Tariffs, rate decisions, and inflation: Your week ahead brief

Well, what a week it has been. And that is putting it mildly. Fortunately, for those of us nursing their geopolitical-induced headaches, this week offers a chance to refocus on central bank decisions, inflation figures, and corporate earnings.

Axie Infinity Price Forecast: AXS rallies as bAXS token reveal boosts retail demand

Axie Infinity is up 3% at press time on Tuesday, extending the 21% gains from Monday and a bullish start to the week. The gaming token regains retail demand following the announcement of its app token, bAXS, to replace the AXS token across the ecosystem and gameplay rewards.