JP Morgan & Chase Co. Elliott Wave technical analysis [Video]
![JP Morgan & Chase Co. Elliott Wave technical analysis [Video]](https://editorial.fxstreet.com/images/TechnicalAnalysis/ChartPatterns/PointFigure/stock-market-data-18635784_XtraLarge.jpg)
JPM Elliott Wave Analysis Trading Lounge
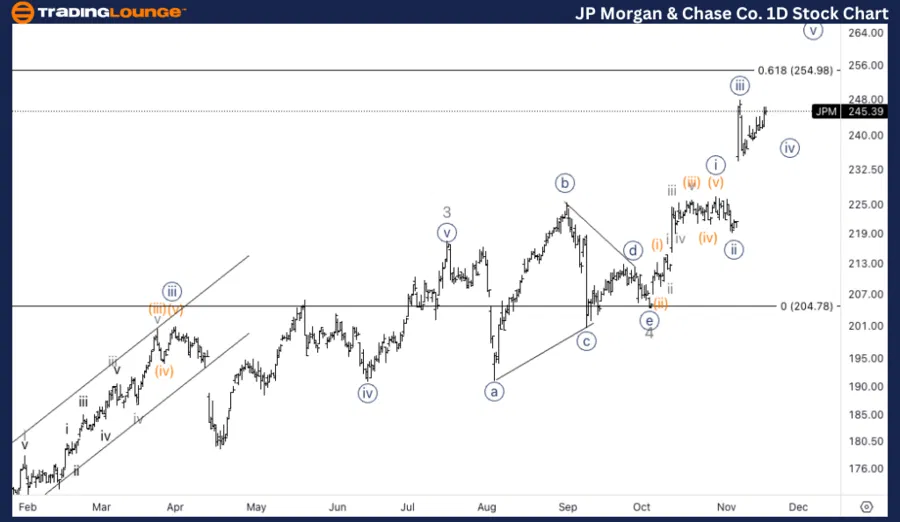
JP Morgan & Chase Co., (JPM) Daily Chart
JPM Elliott Wave technical analysis
Function: Trend.
Mode: Impulsive.
Structure: Motive.
Position: Minor wave 5.
Direction: Upside in 5 of (5).
Details: Looking at further upside within Minor wave 5 as we are trading above TradingLevel2 at 200$ and the next TL stands at 300$.
JPM Elliott Wave technical analysis – Daily chart
On the daily chart, JPM is progressing within Minor wave 5 of the larger wave (5). The stock is trading above TradingLevel2 at $200, indicating a bullish trend. The next key resistance level stands at $300, which could act as a significant psychological and technical barrier.
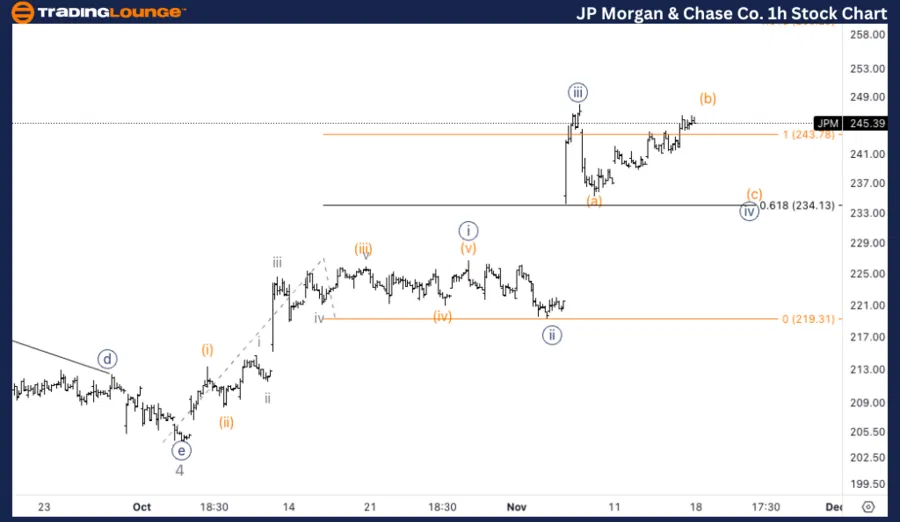
JPM Elliott Wave technical analysis
Function: Trend.
Mode: Impulsive.
Structure: Motive.
Position: Wave {iv} of 5.
Direction: Bottom in wave {iv}.
Details: Looking for another leg lower within wave (c) of {iv} as we are missing downside after a sharp move down(potential wave (a)) and a corresponding pullback higher in what could be wave (b). Looking for MinorGroup1 to hold as support.
JPM Elliott Wave technical analysis – One-hour chart
On the 1-hour chart, JPM is in the midst of completing wave {iv} within Minor wave 5. A sharp move down, potentially wave (a) of {iv}, has occurred, followed by a corrective bounce in wave (b). The next move is expected to be a final leg lower, wave (c), to complete wave {iv}. The area around MinorGroup1 should act as support, potentially marking the bottom of wave {iv} before resuming the upward trend in wave {v}.
This Elliott Wave analysis for JP Morgan & Chase Co., (JPM) examines both the daily and 1-hour charts to assess its current market trend, utilizing Elliott Wave Theory to anticipate potential future movements.
JP Morgan & Chase Co. Elliott Wave technical analysis [Video]
Author

Peter Mathers
TradingLounge
Peter Mathers started actively trading in 1982. He began his career at Hoei and Shoin, a Japanese futures trading company.


