Jobs data: Negative implications for stocks
Stocks didn’t do much on Thursday, with the S&P 500 index closing 0.02% lower after reaching yet another new record high of 5,362.35, which was just 8 points above a high from Wednesday. Today, the futures contracts are pointing to a 0.6% lower opening for the index following the important monthly jobs data. The Nonfarm Payrolls release has been higher than expected at +272,000 m/m, and the Unemployment Rate has also been higher than expected at 4.0%.
In my forecast for June, I wrote “For the last three months, the S&P 500 index has been fluctuating along new record highs, above the 5,000 level which was broken in February. It looks like a consolidation within a long-term uptrend, but it may also be a topping pattern before some meaningful medium-term correction. What is it likely to do? As the saying goes, 'the trend is your friend', so the most likely scenario is more advances in the future.
However, a negative signal would be a breakdown below the 5,000 level. That would raise the question of a deeper correction and downward reversal. I think that the likelihood of a bullish scenario is 60/40 - a downward reversal cannot be completely ruled out. The market will be waiting for more signals from the Fed about potential interest rate easing, plus, at the end of the month, the coming earnings season may dictate the market moves.”
Investor sentiment remained unchanged, as indicated by the AAII Investor Sentiment Survey from Wednesday, which showed that 39.0% of individual investors are bullish, while 32.0% of them are bearish (up from last week's reading of 26.7%). The AAII sentiment is a contrary indicator in the sense that highly bullish readings may suggest excessive complacency and a lack of fear in the market. Conversely, bearish readings are favorable for market upturns.
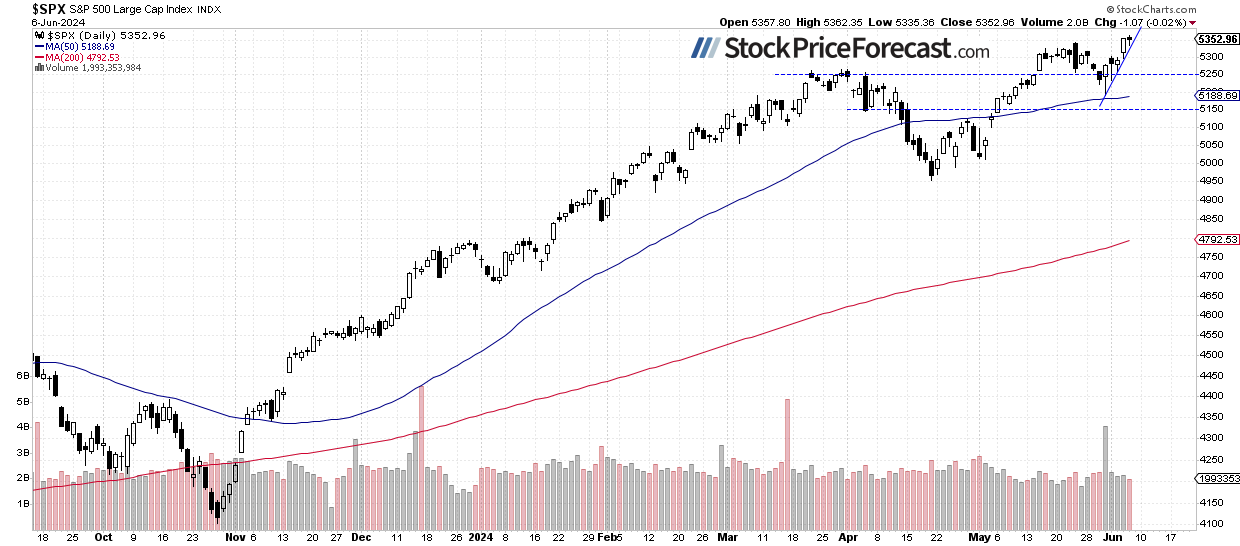
The S&P 500 keeps crawling higher along its short-term upward trend line, remaining above the previous high, as we can see on the daily chart.
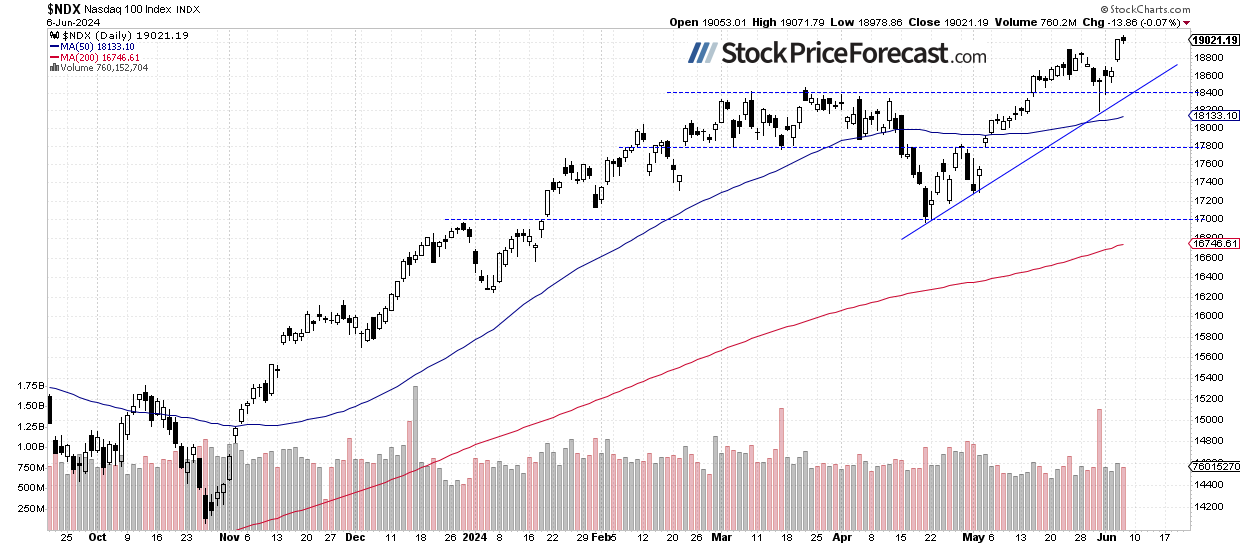
Nasdaq 100 – Yet another new record above 19,000
The technology-focused Nasdaq 100 index reached a new record high of 19,071.79 yesterday, before closing 0.07% lower. The market may see some more uncertainty, and perhaps, a profit-taking action at some point. Today, the Nasdaq 100 index is likely to open 0.6% lower.
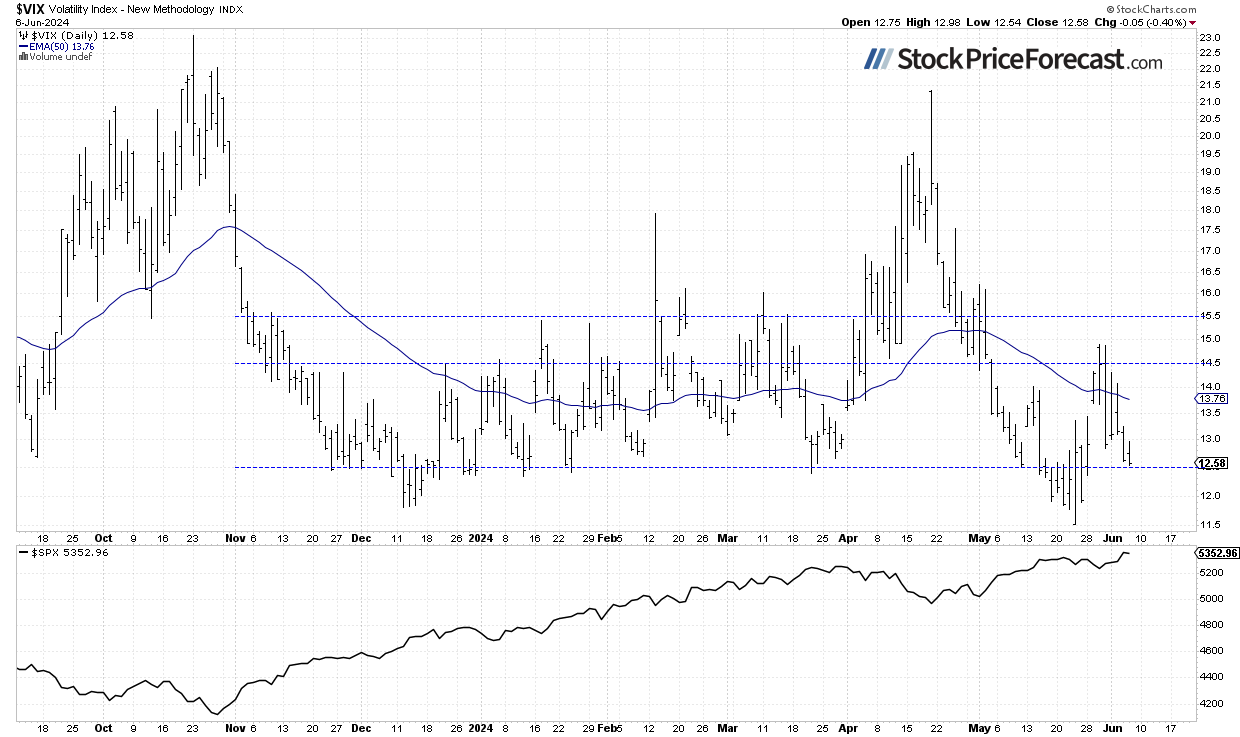
VIX remains below 13
The VIX index, also known as the fear gauge, is derived from option prices. In late March, it was trading around the 13 level. However, market volatility led to an increase in the VIX, and on April 19, it reached a local high of 21.4 - the highest since late October, signaling fear in the market. Recently, it was declining again, and on May 23, it reached its lowest point since November 2019 at 11.52. Yesterday, it extended a decline below the 13 level, indicating less fear amid rising stock prices.
Historically, a dropping VIX indicates less fear in the market, and rising VIX accompanies stock market downturns. However, the lower the VIX, the higher the probability of the market’s downward reversal.
Futures contract – Higher following jobs data
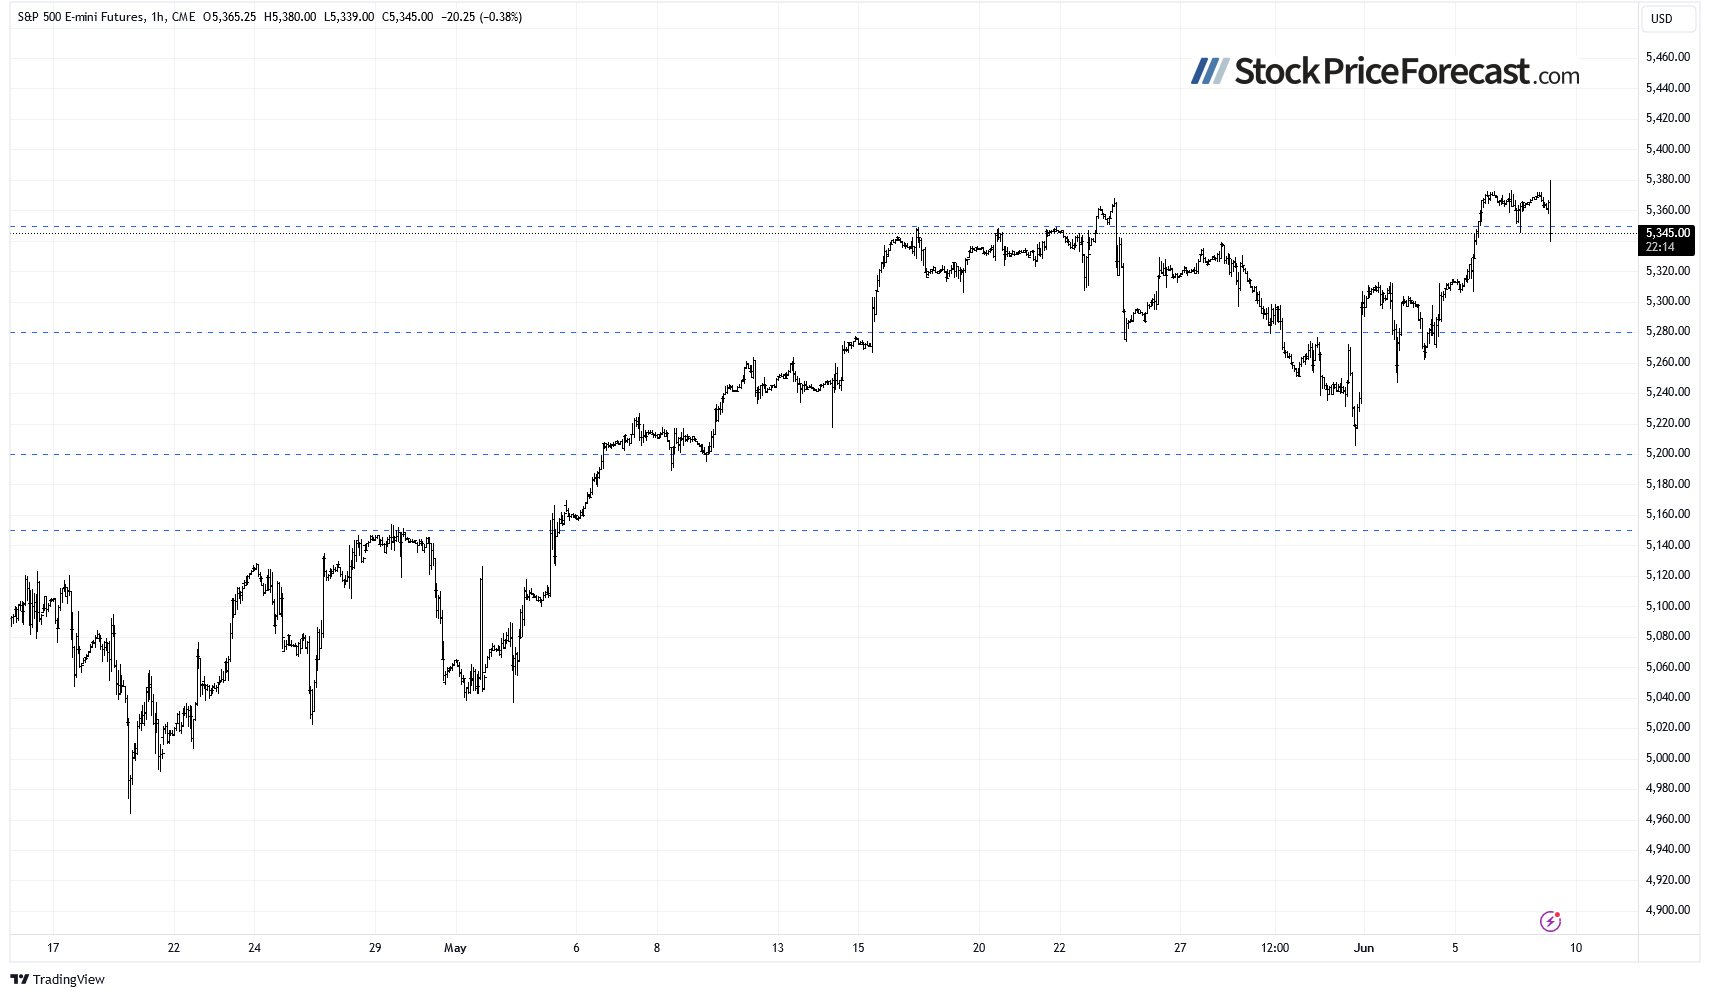
Let’s take a look at the hourly chart of the S&P 500 futures contract. This week, it approached its high from May 23, setting a new record of around 5,370. For now, it looks like a relatively flat correction of the uptrend. However, a profit-taking action cannot be ruled out at some point. Today, the market is trading lower after the jobs data. The support level is at around 5,300-5,320, marked by the recent trading range.
Conclusion
Stock prices are likely to start the day on a negative note after the important monthly jobs report release. The S&P 500 index is likely to remain relatively close to its recently acquired highs; however, a profit-taking action cannot be ruled out at some point.
Will the market retrace some of its recent rally? The bearish argument is relatively thin trading, with only a handful of stocks like NVDA, MSFT, or AAPL responsible for the rally. On the other hand, the trend is still upwards, hence further advances are more likely.
On Tuesday, I noted “The market may see more short-term uncertainty, but a deeper correction now seems less likely.” This still seems very true, especially after this week’s record-breaking advance.
For now, my short-term outlook remains neutral.
Here’s the breakdown:
-
The S&P 500 keeps reaching new all-time highs, but a correction or consolidation may be coming.
-
Last Friday, stock prices were the lowest since early May before rebounding and retracing the whole of the decline.
-
In my opinion, the short-term outlook is neutral.
Want free follow-ups to the above article and details not available to 99%+ investors? Sign up to our free newsletter today!
Want free follow-ups to the above article and details not available to 99%+ investors? Sign up to our free newsletter today!
Author

Paul Rejczak
Sunshine Profits
Paul Rejczak is a stock market strategist who has been known for the quality of his technical and fundamental analysis since the late nineties.


