Infosys Laboratories – INFY Elliott Wave technical analysis [Video]
![Infosys Laboratories – INFY Elliott Wave technical analysis [Video]](https://editorial.fxsstatic.com/images/i/Health-Stocks_1_XtraLarge.png)
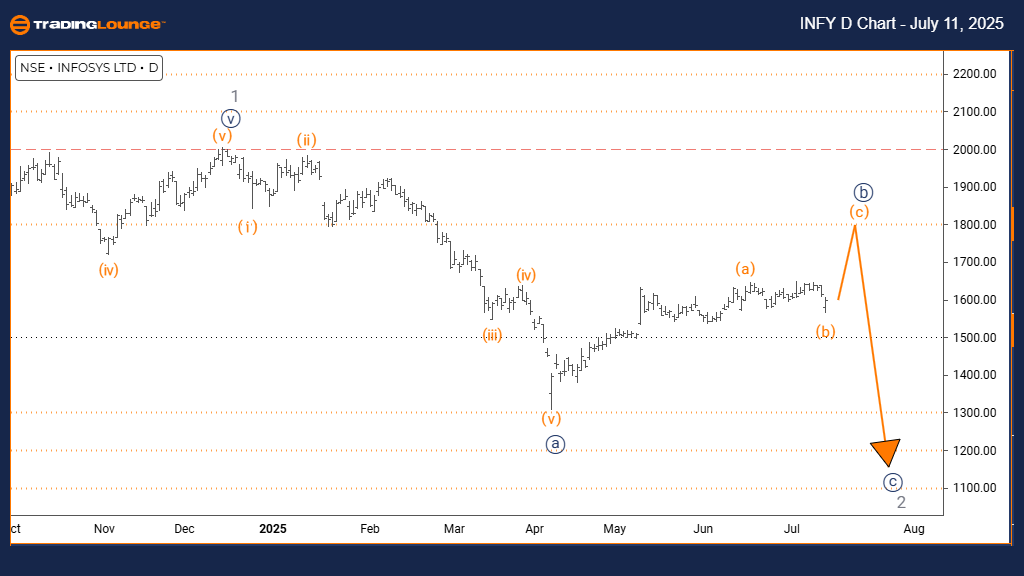
Infosys Laboratories Elliott Wave technical analysis – Day chart
Function: Counter Trend.
Mode: Corrective.
Structure: Orange wave C.
Position: Navy blue wave B.
Direction next lower degrees: Navy blue wave C.
Details: Orange wave B appears completed; orange wave C is now in progress.
The daily chart of Infosys Laboratories reflects a counter-trend setup based on Elliott Wave analysis. The structure indicates an ongoing orange wave C as part of a corrective phase within the larger navy blue wave B. This wave formation suggests the stock remains in a non-directional correction rather than initiating a new trend move. The expected follow-up is navy blue wave C, continuing the current corrective sequence.
Technical observations show that orange wave B likely ended, giving way to the development of orange wave C. This indicates a pause in the broader trend, often characterized by slower price movement and overlapping patterns. Such conditions are common in corrections, often presenting less momentum and more uncertainty. As a result, traders are advised to treat the scenario as a counter-trend opportunity, exercising extra caution due to the complexities of corrective waves.
With orange wave B concluded, the stage is set for the full development of orange wave C, completing the broader correction pattern. Traders monitoring this chart should look for signs of orange wave C nearing completion, which could signal a return to the main trend. This phase fits into a broader corrective structure and helps clarify the stock's short-term potential. While some trading opportunities may arise, market participants should remain cautious due to the unpredictable nature of corrective phases.
This analysis helps frame the current market scenario for Infosys Laboratories, underscoring the importance of risk management and strategy during transitional market behavior. The Elliott Wave approach here provides structured insights into the counter-trend setup and hints at the possible return of the dominant trend after the corrective sequence finishes.
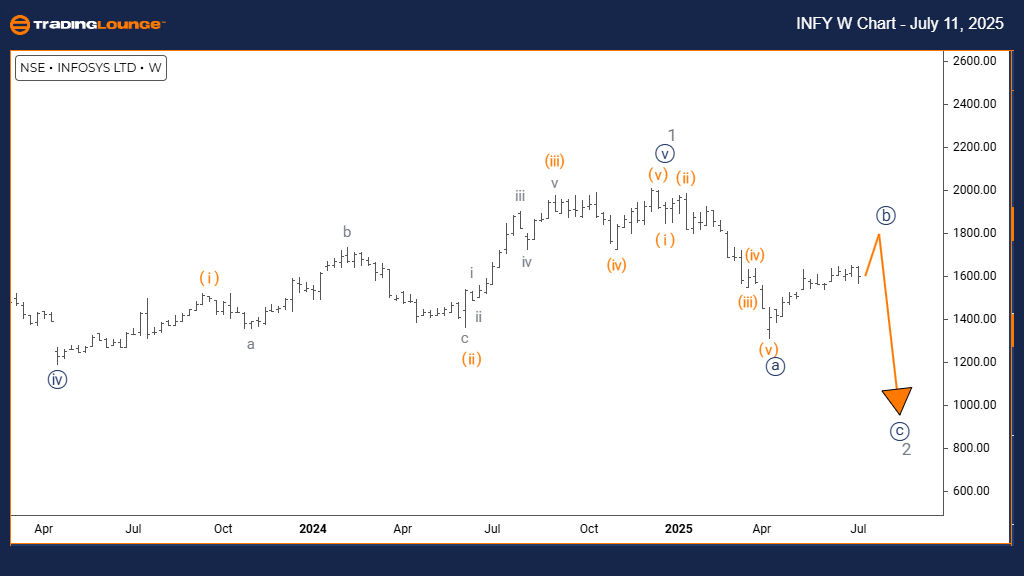
Infosys Laboratories Elliott Wave technical analysis – Weekly chart
Function: Counter Trend.
Mode: Corrective.
Structure: Navy blue wave B.
Position: Gray wave 2.
Direction next lower degrees: Navy blue wave C.
Details: Navy blue wave A appears completed; navy blue wave B is now underway.
The weekly chart analysis of Infosys Laboratories outlines a counter-trend scenario guided by Elliott Wave theory. The stock shows characteristics of a corrective phase, with navy blue wave B forming within a larger wave sequence. It currently holds the position within gray wave 2, indicating a temporary correction in the broader market structure. The next move expected is navy blue wave C, following the likely conclusion of wave B.
Market data suggests navy blue wave A has wrapped up, allowing for the progression of navy blue wave B. This typically marks a pause in the prevailing trend, rather than the start of a new directional move. Analyzing this on the weekly chart gives more weight to the scenario, offering a macro-level view and minimizing the effects of short-term price fluctuations.
Given the corrective nature of the current movement, momentum might be limited, and price action could appear inconsistent with overlapping patterns. Traders are advised to consider this as a potential counter-trend opportunity and stay cautious due to the challenges of trading within corrective waves. The structure established by wave A sets the groundwork for wave B and the anticipated formation of wave C.
Traders watching this development will look for signs indicating the completion of navy blue wave B, which may initiate the next phase – wave C. This analysis places the current correction within its larger context and underscores its role in the ongoing wave structure. Although some trading potential exists, the unpredictable behavior of corrective waves requires prudent risk control.
This Elliott Wave-based evaluation offers structured guidance for navigating the market's current status. The weekly perspective provides particular relevance to medium- and long-term investors, helping interpret significant market trends while also supporting short-term decision-making. As the wave structure unfolds, this framework assists in anticipating the shift back to the primary trend once the correction concludes.
INFY Elliott Wave technical analysis [Video]
Author

Peter Mathers
TradingLounge
Peter Mathers started actively trading in 1982. He began his career at Hoei and Shoin, a Japanese futures trading company.


