International Business Machines Corporation (IBM Stock) earnings for Q3 of 2021

IBM
Inc. IBM is an American multinational technology company headquartered in Armonk, New York. The company was founded in 1911 by Charles Ranlett Flint. The company produces and sells computers, middleware and software. The company also conducts researches, as it holds the record for most annual US patents produced by a company for 28 consecutive years.
The company’s second quarter report of 2021 indicated that the company’s revenues amounted to $18.7 billion (profits increased by 3% year-on-year) after growing by 0.9% in the first quarter. The company predicted that revenue would grow, rather than decline, in the full year. Earnings per share amounted to $2.33 per share. Net cash from operating activities was $17.7 billion and adjusted free cash flow was $11.0 billion over the previous 12 months.
As for total cloud revenue, over the previous 12 months it was $27.0 billion, an increase of 15%. In the quarter, it amounted to $7.0 billion, up 13 percent. Debt has been reduced by $6.4 billion since the end of 2020.
Technical analysis
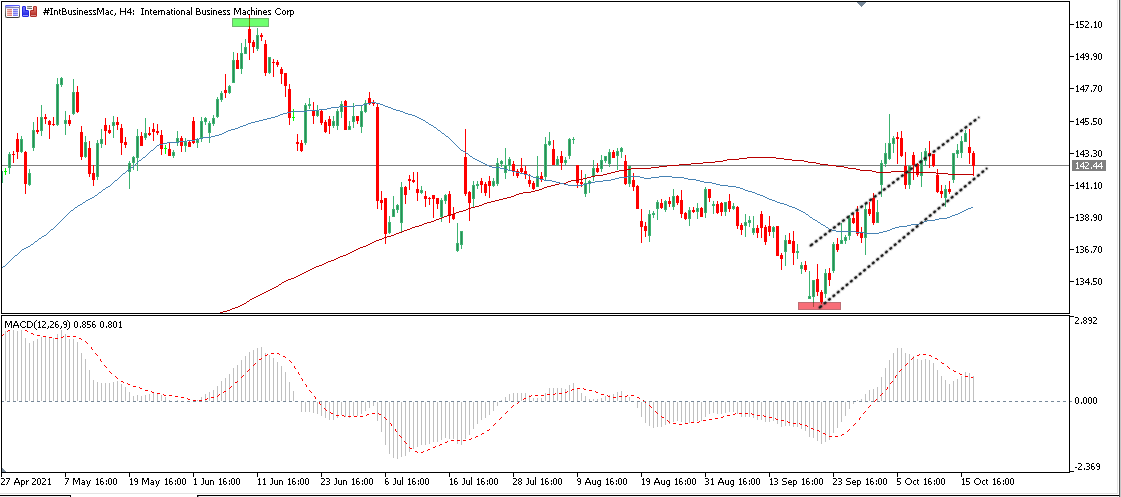
On the 4-hour time frame, the 200-period SMA (red) is above the 50-period SMA (blue). The bullish trend continues since September 22nd up to now (but there is no confirmation that this trend could find further bias to continue). The highest reached was at 152.80 and the lowest support reached was at 132.73. It is now traded at 142.44.
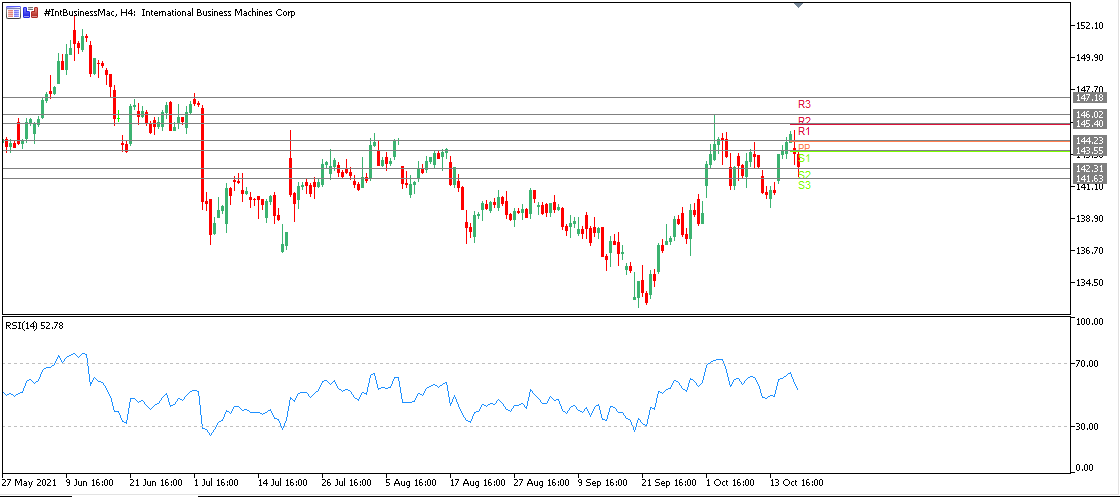
Here in the following picture, we find the main Pivot point levels with Pivot point at 144.23. There are 3 resistances: at 145.40, 146.02 and 147.18. The 3 supports are: at 143.55, 142.31 and 141.63 while the RSI is at 52.78 pointing lower indicating a pullback.
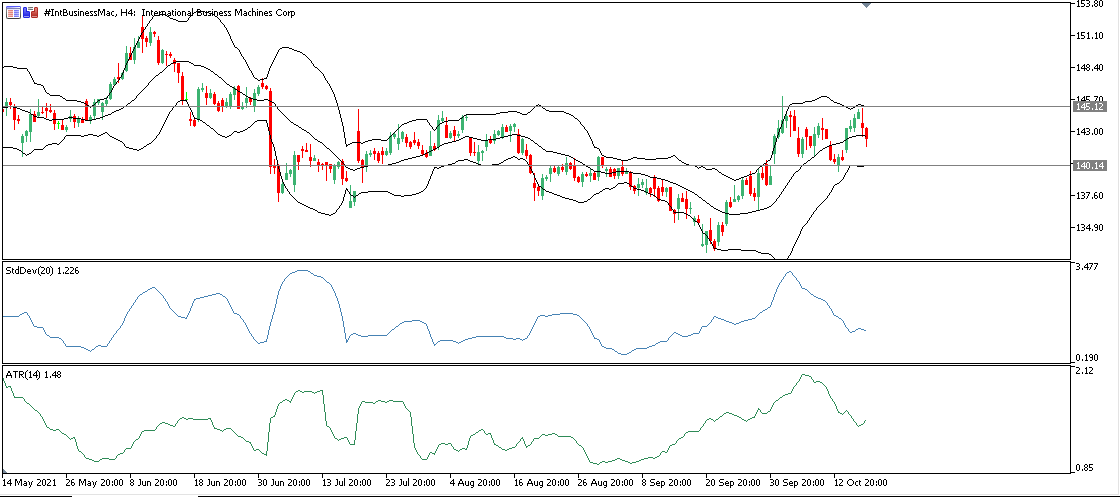
As for the Bollinger Bands indicator, the upper band is at 145.12 while the lower side comes at 140.14 (20-day SMA at 140.00). Here we notice that the upper, middle and lower bands are converging to each other, and this indicates a period of low volatility. Currently the asset manages to cross below the midline suggesting a retest of the lower band. The standard deviation indicator (20) is at 1.226, while the ATR (14) is at 1.48. Hence, the asset presents an increasing negative bias intraday ahead of earnings release, with key support at 140. However, the medium term outlook remains positive as the asset holds at 4-month highs with bullish cross of 20- and 50-day SMA and rising MACD lines, indicating that bulls are still in control. A break below 140 could open the doors to 132 low (September low), while further appreciation above 145, could turn eye to 150-152 area again.
Premium
You have reached your limit of 3 free articles for this month.
Start your subscription and get access to all our original articles.


