Hindalco Industries Elliott Wave technical analysis [Video]
![Hindalco Industries Elliott Wave technical analysis [Video]](https://editorial.fxstreet.com/images/TechnicalAnalysis/ChartPatterns/PointFigure/hand-pointing-graph-elements-of-this-image-furnished-by-nasa-76654497_XtraLarge.jpg)
Hindalco Industries Elliott Wave technical analysis
Function: Larger Degree Trend Higher (Intermediate degree, orange.).
Mode: Motive.
Structure: Impulse.
Position: Minor Wave 5 Grey.
Details: Minor Wave 5 Grey progressing higher within Intermediate Wave (5) against 595. No change.
Invalidation point: 595-600.
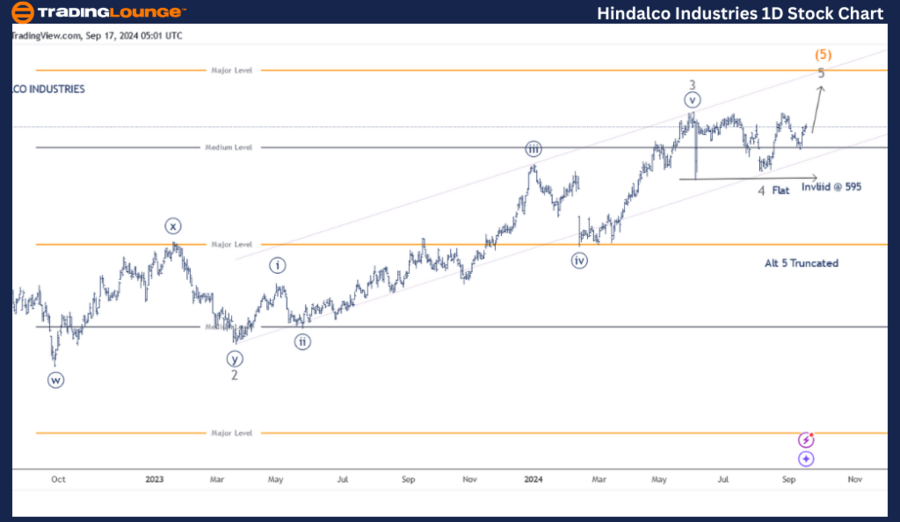
Hindalco Industries daily chart technical analysis and potential Elliott Wave counts
Hindalco Industries daily chart indicates the stock is potentially pushing higher to terminate Minor Wave 5 Grey and subsequently Intermediate Wave (5) Orange above 720 mark. Alternatively, Wave 5 completed truncated around 715.
The stock has been rallying within Intermediate Wave (5) Orange since June 2022, after printing lows around 310, Wave (4) termination. Minor Waves 1 through 3 look complete with third of third wave extended.
Minor Wave 4 terminated as a flat just above 595 mark and the final wave is progressing higher now. If the above proposed structure is correct, prices should stay above 595 and continue pushing higher, going forward. A break lower would suggest re-look at the counts.
Hindalco Industries Elliott Wave technical analysis
Function: Larger Degree Trend Higher (Intermediate degree, orange.).
Mode: Motive.
Structure: Impulse.
Position: Minor Wave 5 Grey.
Details: Minor Wave 5 Grey progressing higher within Intermediate Wave (5) against 595. Alternatively, Wave 5 terminated around 715, truncated.
Invalidation point: 595-600.
Hindalco Industries four-hour chart technical analysis and potential Elliott Wave counts
Hindalco Industries 4H chart highlights sub waves within Minute Wave ((v)) of Minor Wave 3 Grey and further. Minor Wave 4 Grey could be marked as a running flat complete above 600 mark. If correct, Minor Wave 5 is underway with Minute Waves ((i)) and ((ii)) potentially complete.
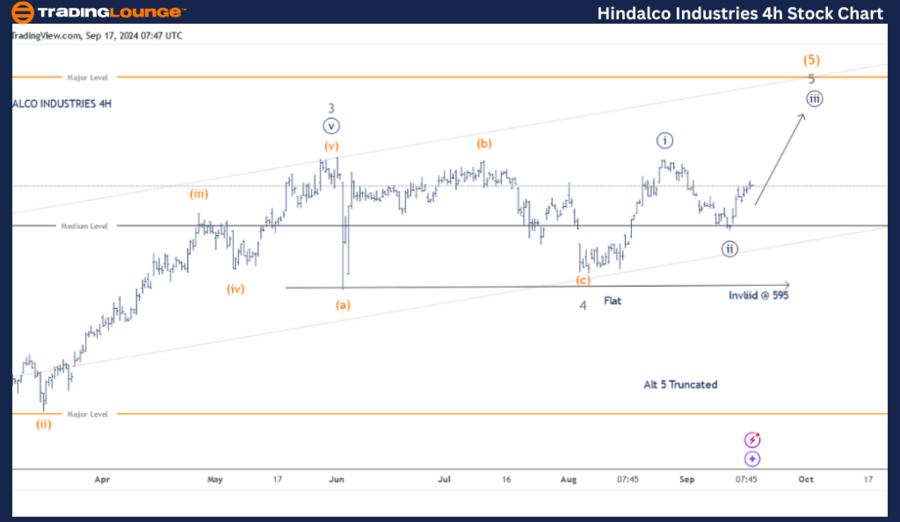
Conclusion
Hindalco Industries is progressing higher within Minute Wave ((iii)) of Minor Wave 5 Grey against 595 mark.
Hindalco Industries Elliott Wave technical analysis [Video]
Author

Peter Mathers
TradingLounge
Peter Mathers started actively trading in 1982. He began his career at Hoei and Shoin, a Japanese futures trading company.


