Highest proportion of money managers in more than two decades call US stocks ‘overvalued’
- Bank of America's survey has 89% of money managers calling equities 'overvalued'.
- The average rating this decade has been 81% however.
- The Dow Jones index is trading at a valuation well above its long-term average.
- The DJIA reached a double-top formation in the past three months, which bodes bearish.

If your portfolio has been sitting pretty of late, don’t count your laurels. A respected survey of money managers has pronounced the US stock market the most “overvalued” at any time since at least April 2001 (when the survey began asking the question) and likely this century.
Bank of America unveiled its February Global Fund Manager Survey (FMS) this week, and it’s a doozy. The report surveys the sentiment among 205 large money managers who collectively manage $482 billion in assets.
89% of respondents to the survey told BofA that the US stock market is “overvalued”. That is the largest proportion since the survey began being administered nearly 24 years ago.
Dow Jones valuation
The high for the Dow Jones Industrial Average (DJIA) in April 2001 was 10,906. From there the index would collapse as much as 34% over the following 18 months to a low of 7,197 as part of a three-year decline. Of course, a certain event involving hijacked airplanes and collapsing skyscrapers aided in that correction. However, only 30% of respondents thought the US market was overvalued in April 2001.
Fast forward to the 2020s, and we find that February 2025 is not all that out of character. Respondents have spent much of this decade viewing the stock market as overvalued. In fact, since the covid pandemic began in early 2020, a number of BofA’s surveys have received “overvalued” values above 80%. Really only the 2022 bear market saw much of a change.
One of the report’s authors, BofA strategist Michael Hartnett, says the average “overvalued” consensus this decade has been 81% of respondents. Hartnett blames this on the “US exceptionalism” trade, which saw US stocks benefit from an appreciating US Dollar and strong gains by the so-called Magnificent 7 stocks.
However, Hartnett thinks this trade might have peaked. In February, this trade "was viewed as the most crowded trade by 73% of FMS investors, a decline from the three-year high of 80% reached in January."
According to data from Gurufocus.com, the Dow Jones is currently trading near a price-to-earnings ratio of 27. This is well above the 20-year median of 18 but a good breadth below the 34 ratio reached in early 2021.
But of course the Dow Jones is more of a value index to begin with despite adding Nvidia (NVDA) and Salesforce (CRM) in 2024. The NASDAQ 100, known for its focus on growth and tech stocks, is trading above 37 times earnings right in the vicinity with its early 2021 range high.
One reason for higher equity valuations noted in the report is that fund managers are leaving little cash on the sidelines. The average cash holding is 3.5% among money managers, which amounts to a 15-year low.
But timing a major correction is always difficult. The Federal Reserve’s (Fed) Meeting Minutes offer one reason for pessimism. Wednesday’s release showed that the central bank is most worried about the Trump administration’s adoption of tariffs.
“Business contacts in a number of districts had indicated that firms would attempt to pass on to consumers higher input costs arising from potential tariffs," says a readout of the Fed’s Meeting Minutes.
Continued pricing pressure would likely forestall the central bank from cutting interest rates this year, which could dishearten investors counting on them. Currently, the market still expects about 50 basis points worth of cuts in the latter half of the year.
Dow Jones weekly chart
The technicals give us more reason for pessimism. The weekly chart of the DJIA shows the index petering out twice in a row in the region just above 45,000. In both cases — late November 2024 and then January 2025 — the index reached resistance between 45,050 and 45,070.
This should count as a bearish double-top formation to most traders and typically means that technical traders will expect a pullback. So far, this hasn’t materialized in any major fashion. However, at the very least a sell-off would return the DJIA to the support channel spanning from 41,650 to 42,100.
Another option would be the 52-week Simple Moving Average (SMA) near 41,225. With the help of a news catalyst such as another poor inflation reading, expect the DJIA to drop back to April 2024 support near 38,000.
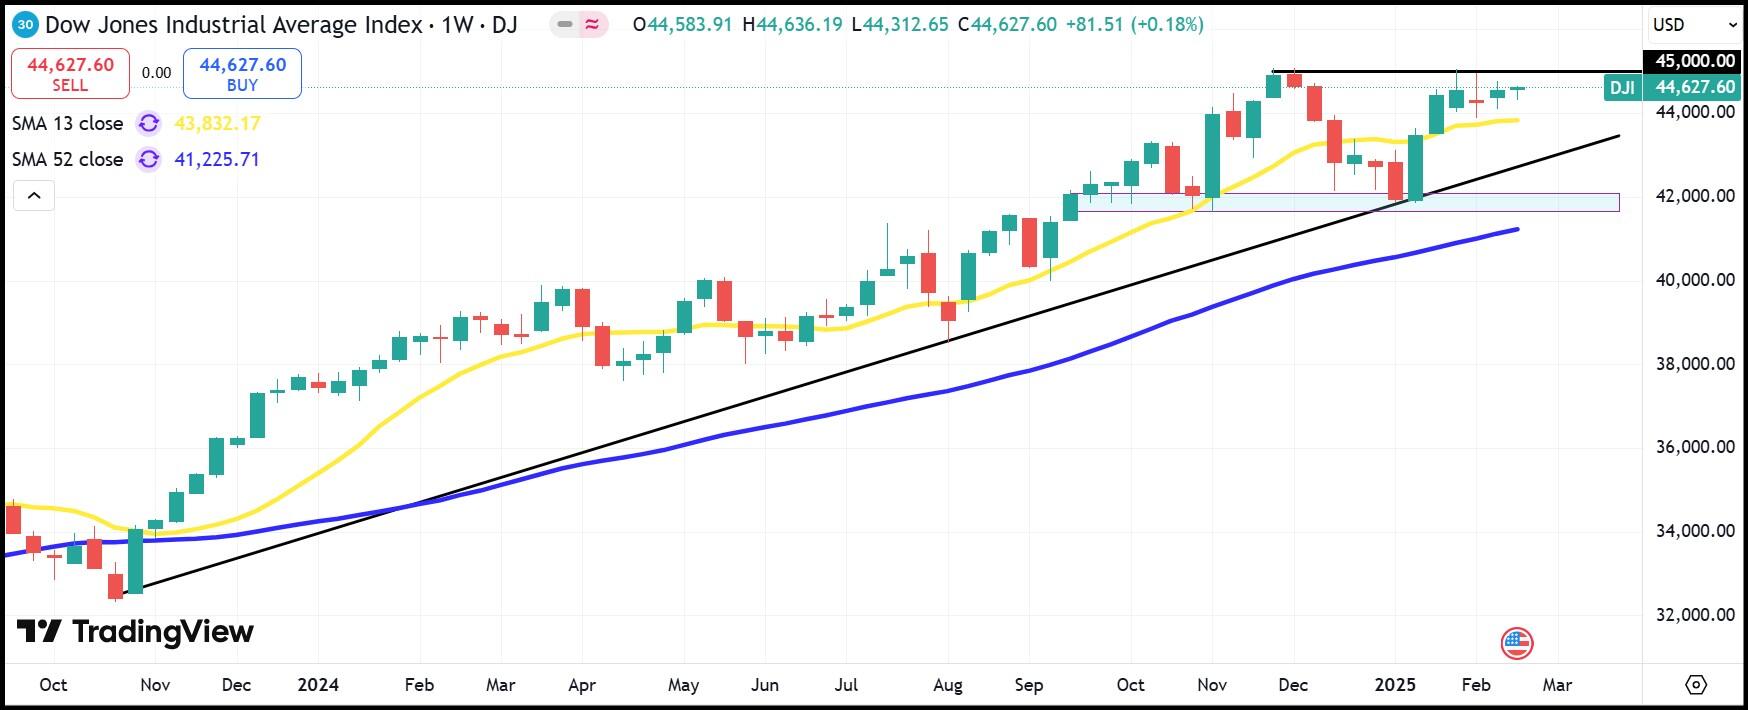
DJIA weekly chart
Premium
You have reached your limit of 3 free articles for this month.
Start your subscription and get access to all our original articles.
Author

Clay Webster
FXStreet
Clay Webster grew up in the US outside Buffalo, New York and Lancaster, Pennsylvania. He began investing after college following the 2008 financial crisis.


